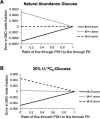
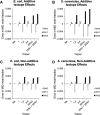
Kinetic isotope effects significantly influence intracellular metabolite (13) C labeling patterns and flux determination
- PMID: 23828762
- PMCID: PMC4045492
- DOI: 10.1002/biot.201200276
Kinetic isotope effects significantly influence intracellular metabolite (13) C labeling patterns and flux determination
Abstract
Rigorous mathematical modeling of carbon-labeling experiments allows estimation of fluxes through the pathways of central carbon metabolism, yielding powerful information for basic scientific studies as well as for a wide range of applications. However, the mathematical models that have been developed for flux determination from (13) C labeling data have commonly neglected the influence of kinetic isotope effects on the distribution of (13) C label in intracellular metabolites, as these effects have often been assumed to be inconsequential. We have used measurements of the (13) C isotope effects on the pyruvate dehydrogenase enzyme from the literature to model isotopic fractionation at the pyruvate node and quantify the modeling errors expected to result from the assumption that isotope effects are negligible. We show that under some conditions kinetic isotope effects have a significant impact on the (13) C labeling patterns of intracellular metabolites, and the errors associated with neglecting isotope effects in (13) C-metabolic flux analysis models can be comparable in size to measurement errors associated with GC-MS. Thus, kinetic isotope effects must be considered in any rigorous assessment of errors in (13) C labeling data, goodness-of-fit between model and data, confidence intervals of estimated metabolic fluxes, and statistical significance of differences between estimated metabolic flux distributions.
Keywords: Isotope Effects; Isotopomer Modeling; Metabolic Engineering; Metabolic Flux Analysis; Modeling errors.
Copyright © 2013 WILEY-VCH Verlag GmbH & Co. KGaA, Weinheim.
Figures


Similar articles
-
Isotope labeling pattern study of central carbon metabolites using GC/MS.J Chromatogr B Analyt Technol Biomed Life Sci. 2015 Jan 1;974:101-8. doi: 10.1016/j.jchromb.2014.10.033. Epub 2014 Nov 3. J Chromatogr B Analyt Technol Biomed Life Sci. 2015. PMID: 25463204
-
Comprehensive metabolic modeling of multiple 13C-isotopomer data sets to study metabolism in perfused working hearts.Am J Physiol Heart Circ Physiol. 2016 Oct 1;311(4):H881-H891. doi: 10.1152/ajpheart.00428.2016. Epub 2016 Aug 5. Am J Physiol Heart Circ Physiol. 2016. PMID: 27496880 Free PMC article.
-
Flux and reflux: metabolite reflux in plant suspension cells and its implications for isotope-assisted metabolic flux analysis.Mol Biosyst. 2014 Jun;10(6):1496-508. doi: 10.1039/c3mb70348g. Epub 2014 Mar 28. Mol Biosyst. 2014. PMID: 24675729
-
Parallel labeling experiments for pathway elucidation and (13)C metabolic flux analysis.Curr Opin Biotechnol. 2015 Dec;36:91-7. doi: 10.1016/j.copbio.2015.08.014. Epub 2015 Aug 28. Curr Opin Biotechnol. 2015. PMID: 26322734 Review.
-
In vivo stationary flux analysis by 13C labeling experiments.Adv Biochem Eng Biotechnol. 1996;54:109-54. doi: 10.1007/BFb0102334. Adv Biochem Eng Biotechnol. 1996. PMID: 8623613 Review.
Cited by
-
Metabolomic and (13)C-metabolic flux analysis of a xylose-consuming Saccharomyces cerevisiae strain expressing xylose isomerase.Biotechnol Bioeng. 2015 Mar;112(3):470-83. doi: 10.1002/bit.25447. Epub 2014 Nov 24. Biotechnol Bioeng. 2015. PMID: 25311863 Free PMC article.
-
The rate of lactate production from glucose in hearts is not altered by per-deuteration of glucose.J Magn Reson. 2017 Nov;284:86-93. doi: 10.1016/j.jmr.2017.09.007. Epub 2017 Sep 18. J Magn Reson. 2017. PMID: 28972888 Free PMC article.
-
Isotopic ratio outlier analysis global metabolomics of Caenorhabditis elegans.Anal Chem. 2013 Dec 17;85(24):11858-11865. doi: 10.1021/ac4025413. Epub 2013 Dec 4. Anal Chem. 2013. PMID: 24274725 Free PMC article.
-
OpenFLUX2: (13)C-MFA modeling software package adjusted for the comprehensive analysis of single and parallel labeling experiments.Microb Cell Fact. 2014 Nov 19;13:152. doi: 10.1186/s12934-014-0152-x. Microb Cell Fact. 2014. PMID: 25408234 Free PMC article.
-
Evolution of E. coli on [U-13C]Glucose Reveals a Negligible Isotopic Influence on Metabolism and Physiology.PLoS One. 2016 Mar 10;11(3):e0151130. doi: 10.1371/journal.pone.0151130. eCollection 2016. PLoS One. 2016. PMID: 26964043 Free PMC article.
References
-
- Fischer E, Sauer U. Large-scale in vivo flux analysis shows rigidity and suboptimal performance of Bacillus subtilis metabolism. Nat. Genet. 2005;37:636–640. - PubMed
Publication types
MeSH terms
Substances
Grants and funding
LinkOut - more resources
Full Text Sources
Other Literature Sources
Miscellaneous

