. 2013 Sep 15;29(18):2253-60.
doi: 10.1093/bioinformatics/btt389. Epub 2013 Jul 4.

Scalable metagenomic taxonomy classification using a reference genome database

Affiliations

Scalable metagenomic taxonomy classification using a reference genome database

Sasha K Ames et al. Bioinformatics. .

Abstract

Motivation: Deep metagenomic sequencing of biological samples has the potential to recover otherwise difficult-to-detect microorganisms and accurately characterize biological samples with limited prior knowledge of sample contents. Existing metagenomic taxonomic classification algorithms, however, do not scale well to analyze large metagenomic datasets, and balancing classification accuracy with computational efficiency presents a fundamental challenge.

Results: A method is presented to shift computational costs to an off-line computation by creating a taxonomy/genome index that supports scalable metagenomic classification. Scalable performance is demonstrated on real and simulated data to show accurate classification in the presence of novel organisms on samples that include viruses, prokaryotes, fungi and protists. Taxonomic classification of the previously published 150 giga-base Tyrolean Iceman dataset was found to take <20 h on a single node 40 core large memory machine and provide new insights on the metagenomic contents of the sample.

Availability: Software was implemented in C++ and is freely available at http://sourceforge.net/projects/lmat

Contact: allen99@llnl.gov

Supplementary information: Supplementary data are available at Bioinformatics online.


Figures

Fig. 1.
Fig. 1.
Example k-mer/taxonomy database. Input includes the taxonomy tree with interior tree nodes formula image
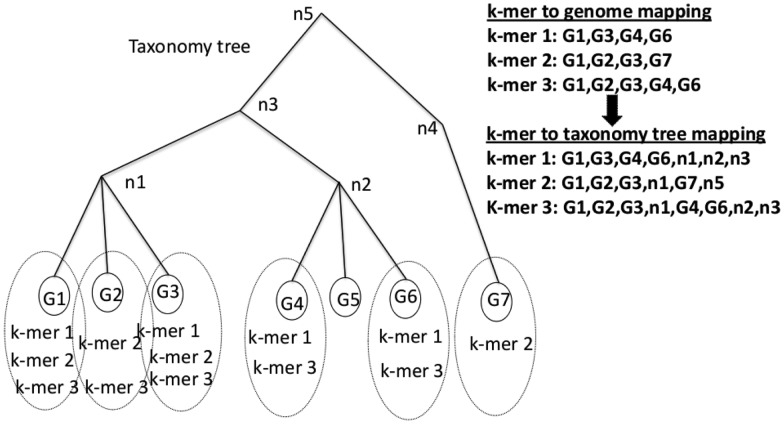
, and leaf node genomes formula image, all of which are labeled with taxonomy IDs. k-mers (k-mer1, k-mer2, k-mer3) are linked to their source genomes (dotted circles) and their taxonomy hierarchy up to the LCA
Fig. 2.
Fig. 2.
Example scoring procedure. The query read is converted to k-mers (k-mer1, k-mer2, k-mer3), and their associated taxonomy information retrieved from the database. A classification table is created with columns for candidate taxonomic IDs and rows representing a specific k-mer, with a binary entry reporting the presence or absence of the k-mer in some genome associated with the taxonomic node. The last row shows k-mer row sum divided by the total number of k-mer rows. The underlined entries highlight nodes that are created at run time
Fig. 3.
Fig. 3.
Label selection process. The list of candidate taxonomic labels ordered 1 through 9 is sorted by label score (G1,1.0), … ,(G7,0.33). Steps 1, 2, 6 and 9 where an action is performed are shown. At step 1, the taxonomy lineage is constructed from the best first label G1. Step 2, G3 conflicts with G1 and the lineage is pruned to n1. Step 6, G4 conflicts with n1 and the lineage is pruned to n3. For demonstration at step 9, score 0.33 for the G7 label is below threshold and the procedure terminates and returns n3 as the classification
Fig. 4.
Fig. 4.
Species-level accuracy comparing reference databases/algorithms’ performance on PhymmBL query set. Classifier performance is shown using the full database (LMAT-kFull), and a marker database (LMAT-kML), and is compared with other software, Genometa, PhymmBL and MetaPhlAn. LMAT-kFULL performance is underneath the LMAT-kML plot, highlighting similar performance
Fig. 5.
Fig. 5.
Classification accuracy when novel genomes are included in the input sets. The two database types are considered Full (kFull) and the marker library (kML). Left panel shows performance for simulated viral metagenomes with 25 total species and 10 novel genomes. Middle panel shows 75 total species including 14 novel genomes and right panel shows 5 protist/fungi with one 1 novel genome included. x-axis counts the number of species reported that are not present (False Positives) and the y-axis counts the number of true species present that are reported (True Positives). The performance curve reflects 300 different threshold values for minimum number of labeled reads required to make a species call
Fig. 6.
Fig. 6.
Run time performance. Tests run on three real metagenomic datasets SRX, DRR and ERR. Run times are shown for the metagenomic classifiers (LMAT-kFull, LMAT-kML and MetaPhlAn using Bowtie2 for read mapping and its reference database) and simple sequence searches for Bowtie2 and blastn (BLAST) using the same full reference genomes found in kFull. We report run time normalized to the percentage of mapped or labeled reads. Note log scale on y-axis; values given within each bar

References

    1. Angiuoli SV, et al. Resources and costs for microbial sequence analysis evaluated using virtual machines and cloud computing. PLoS One. 2011;6:e26624. - PMC - PubMed
    1. Barthelson R, et al. Plantagora: modeling whole genome sequencing and assembly of plant genomes. PLoS One. 2011;6:e28436. - PMC - PubMed
    1. Berendzen J, et al. Rapid phylogenetic and functional classification of short genomic fragments with signature peptides. BMC Res. Notes. 2012;5:460. - PMC - PubMed
    1. Brady A, Salzberg S. PhymmBL expanded: confidence scores, custom databases, parallelization and more. Nat. Methods. 2011;8:367. - PMC - PubMed
    1. Davenport CF, et al. Genometa—a fast and accurate classifier for short metagenomic shotgun reads. PLoS One. 2012;7:e41224. - PMC - PubMed

Publication types