. 2013 Oct;12(10):2689-700.
doi: 10.1074/mcp.M113.029306. Epub 2013 Jul 4.

Role of Fas-associated death domain-containing protein (FADD) phosphorylation in regulating glucose homeostasis: from proteomic discovery to physiological validation

Affiliations

Role of Fas-associated death domain-containing protein (FADD) phosphorylation in regulating glucose homeostasis: from proteomic discovery to physiological validation

Chun Yao et al. Mol Cell Proteomics. 2013 Oct.

Abstract

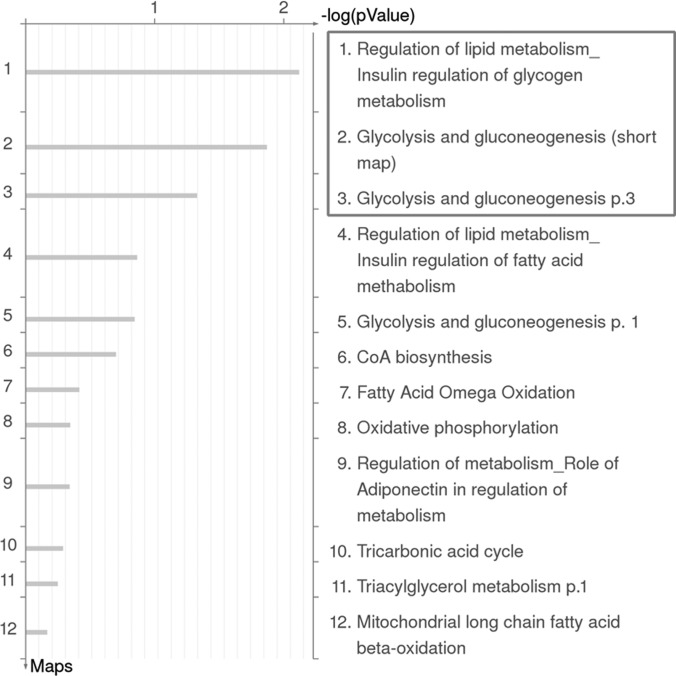
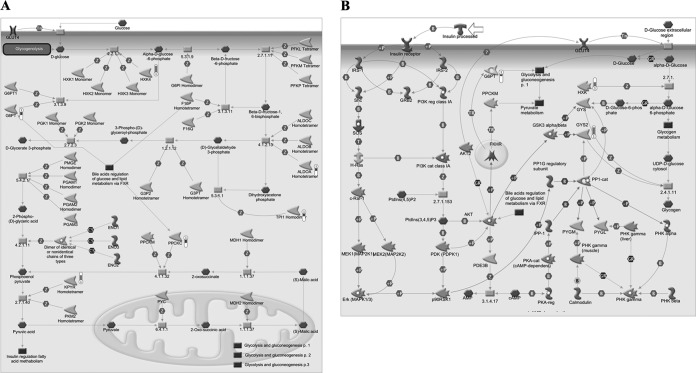
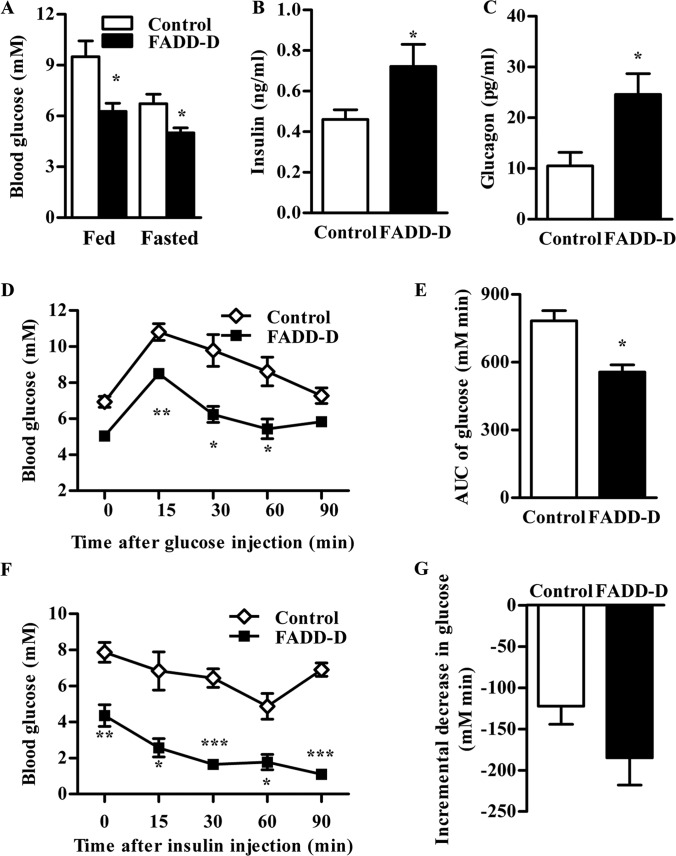
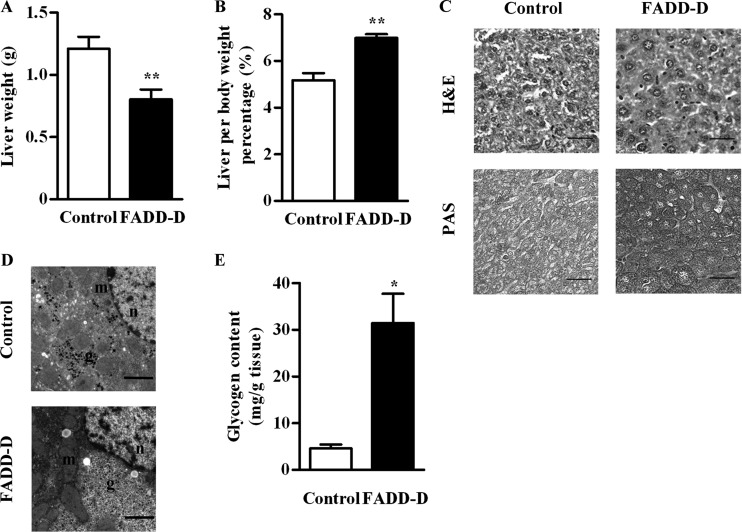
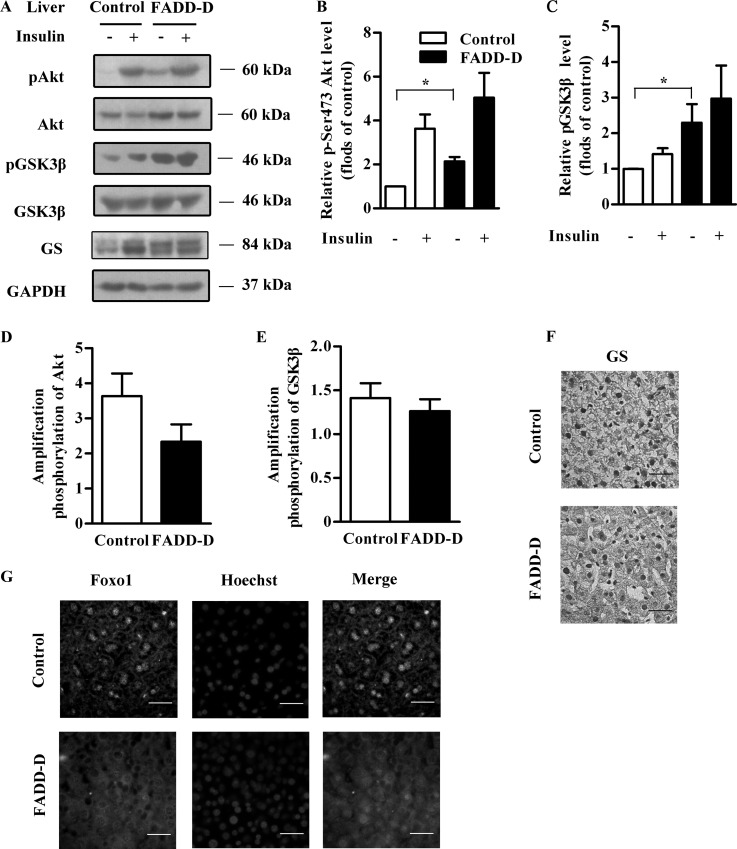
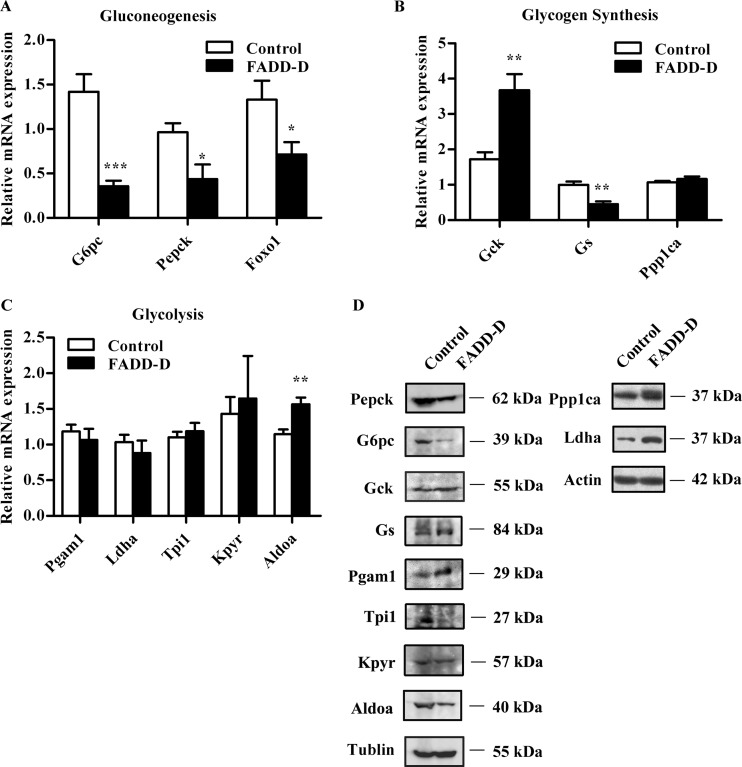
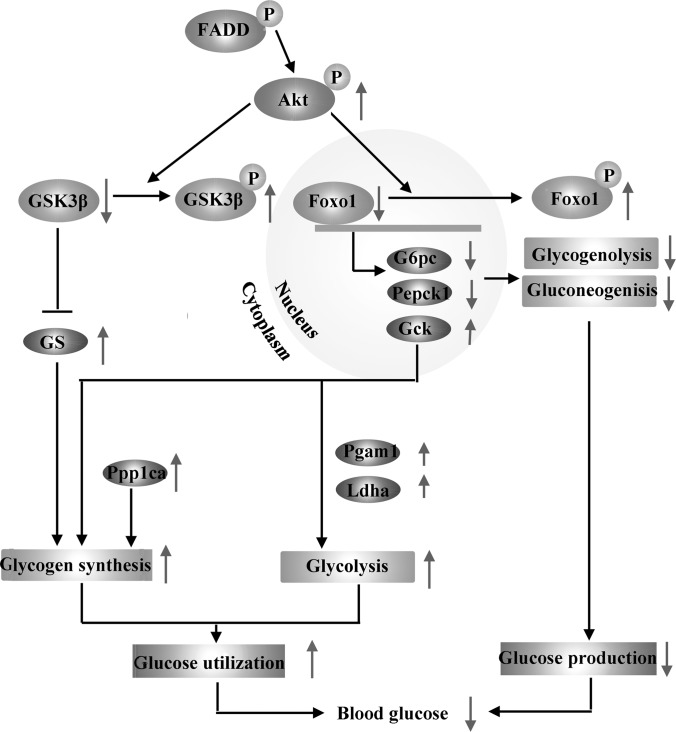
Fas-associated death domain-containing protein (FADD), a classical apoptotic signaling adaptor, participates in different nonapoptotic processes regulated by its phosphorylation. However, the influence of FADD on metabolism, especially glucose homeostasis, has not been evaluated to date. Here, using both two-dimensional electrophoresis and liquid chromatography linked to tandem mass spectrometry (LC/MS/MS), we found that glycogen synthesis, glycolysis, and gluconeogenesis were dysregulated because of FADD phosphorylation, both in MEFs and liver tissue of the mice bearing phosphorylation-mimicking mutation form of FADD (FADD-D). Further physiological studies showed that FADD-D mice exhibited lower blood glucose, enhanced glucose tolerance, and increased liver glycogen content without alterations in insulin sensitivity. Moreover, investigations on the molecular mechanisms revealed that, under basal conditions, FADD-D mice had elevated phosphorylation of Akt with alterations in its downstream signaling, leading to increased glycogen synthesis and decreased gluconeogenesis. Thus, we uncover a novel role of FADD in the regulation of glucose homeostasis by proteomic discovery and physiological validation.


Figures

Fig. 1.
Fig. 1.
Representation of ontological category of differentially expressed proteins in control and FADD-D cell lines by GeneGo Map Folders analysis. The results were ordered by -log10 of the p value of the hypergeometric distribution. Detailed GeneGo Maps in Fold “energy metabolism and its regulation” were shown.
Fig. 2.
Fig. 2.
GeneGO pathway showing changes in expression of liver proteins involved in glycolysis and gluconeogenesis (A), insulin regulation of glycogen metabolism (B) upon FADD phosphorylation. The various proteins on this map are represented by different symbols (representing the functional class of the protein). Thermometers with blue or red shading next to symbols depict proteins identified in the present study: blue color represents the proteins that were down-regulated in FADD-D mice liver relative to control group; red color represents the proteins that were up-regulated in FADD-D mice liver relative to control group.
Fig. 3.
Fig. 3.
Low blood glucose and increased glucose tolerance in FADD-D mice. A, Fed and fasted blood glucose level in mice (n = 4–9 for each group). B and C, Fasted serum insulin (B) and glucagon (C) levels in mice (n = 6–12 for each group). D, IPGTT of FADD-D (black squares) and control mice (white diamonds). Mice were injected intraperitoneally with 1.0 g/kg glucose, and blood glucose levels were monitored at the intervals indicated (n = 3). E, The histogram represents the cumulative increase in blood glucose from basal level after the injection of glucose during IPGTT. F, IPITT of FADD-D (black squares) and control mice (white diamonds). Mice were injected intraperitoneally with 0.5 U/kg insulin, and blood glucose levels were monitored at the intervals indicated (n = 3). G, The histogram represents the cumulative decrease in blood glucose from the basal level after the injection of insulin during IPITT. Data are presented as means ± S.E. Statistical significance was assessed by two-tailed Student's t test, *p < 0.05, **p < 0.01, ***p < 0.001.
Fig. 4.
Fig. 4.
Increased hepatic glycogen content in FADD-D mice. A, Liver weights of FADD-D and control mice (n = 4). B, Weights of liver normalized by body weight for FADD-D and control mice (n = 4). C, H&E staining and PAS staining for glycogen in the liver sections of FADD-D and control mice. Representative images are shown. Scale bar, 20 μm. D, The representative images of electron microscopic analysis of liver. Scale bar, 2 μm. “g” indicates glycogen, “m” indicates mitochondria, and “n” indicates nucleus. E, Hepatic glycogen content determined by glucose assay kit (n = 6). Data are presented as means ± S.E. Statistical significance was assessed by two-tailed Student's t test, *p < 0.05, **p < 0.01.
Fig. 5.
Fig. 5.
Enhanced Akt phosphorylation in the liver of FADD-D mice. A, Western blots of liver tissue lysates from FADD-D and control mice were performed after insulin treatment to assess phospho-Akt, phospho-GSK3β, as well as total Akt, GSK3β, GS and GAPDH expression levels (n = 3 for each group). B and C, Densitometric analysis of phospho-Akt (B) and phospho-GSK3β levels (C) in (A). D and E, Amplification of Akt phosphorylation (D) and GSK3β phosphorylation (E) after insulin stimulation. F, GS immunostaining in liver sections of FADD-D and control mice (n = 3 for each group). Scale bar, 20 μm. G, Immunohistochemistry with anti-Foxo1 antibody (green) and Hoechst (blue) to show the localization of Foxo1 in liver sections of FADD-D and control mice (n = 4 for each group). Scale bar, 20 μm. Data are presented as means ± S.E. Statistical significance was assessed by two-tailed Student's t test, *p < 0.05.
Fig. 6.
Fig. 6.
Expression of genes involved in glucose homeostasis in FADD-D mice. A–C, Relative hepatic mRNA expression of genes involved in gluconeogenesis (A), glycogen synthesis (B) and glycolysis (C) (n = 4–6 for each group). D, Western blots of proteins involved in glucose metabolism including Pepck, G6pc, Gck, Gs, Pgam1, Tpi1, Kpyr, Aldoa, Ppp1ca, and Ldha. Data are presented as means ± S.E. Statistical significance was assessed by two-tailed Student's t test, *p < 0.05, **p < 0.01, ***p < 0.005.
Fig. 7.
Fig. 7.
Schematic representation of the altered glucose homeostasis in FADD-D mice. Elevated Akt phosphorylation in FADD-D mice inactivated GSK3β and increased active form of GS, together with the highly expressed Gck and Ppp1ca, leading to enhanced glycogen accumulation. On the other hand, Akt phosphorylated and inactivated Foxo1, which regulates the transcription of G6pc and Pepck, suppressing gluconeogenesis and glycogenolysis. The expression levels of proteins involved in glycolysis were also changed. As a result, there was a low blood glucose level in FADD-D mice. The purple ellipses indicate proteins with changed expression we have found in proteomics and verified by Western blots.

References

    1. Boldin M. P., Varfolomeev E. E., Pancer Z., Mett I. L., Camonis J. H., Wallach D. (1995) A novel protein that interacts with the death domain of Fas/APO1 contains a sequence motif related to the death domain. J. Biol. Chem. 270, 7795–7798 - PubMed
    1. Chinnaiyan A. M., Orourke K., Tewari M., Dixit V. M. (1995) FADD, A Novel Death Domain-Containing Protein, Interacts With the Death Domain of Fas and Initiates Apoptosis. Cell. 81, 505–512 - PubMed
    1. Zhang J., Winoto A. (1996) A mouse Fas-associated protein with homology to the human Mort1/FADD protein is essential for Fas-induced apoptosis. Mol. Cell. Biol. 16, 2756–2763 - PMC - PubMed
    1. Kim P. K., Dutra A. S., Chandrasekharappa S. C., Puck J. M. (1996) Genomic structure and mapping of human FADD, an intracellular mediator of lymphocyte apoptosis. J. Immunol. 157, 5461–5466 - PubMed
    1. Schneider P., Thome M., Burns K., Bodmer J. L., Hofmann K., Kataoka T., Holler N., Tschopp J. (1997) TRAIL receptors 1 (DR4) and 2 (DR5) signal FADD-dependent apoptosis and activate NF-kappaB. Immunity 7, 831–836 - PubMed

Publication types