. 2013 Aug 20;85(16):7713-9.
doi: 10.1021/ac400751j. Epub 2013 Aug 2.

An untargeted metabolomic workflow to improve structural characterization of metabolites

Affiliations

An untargeted metabolomic workflow to improve structural characterization of metabolites

Igor Nikolskiy et al. Anal Chem. .

Abstract

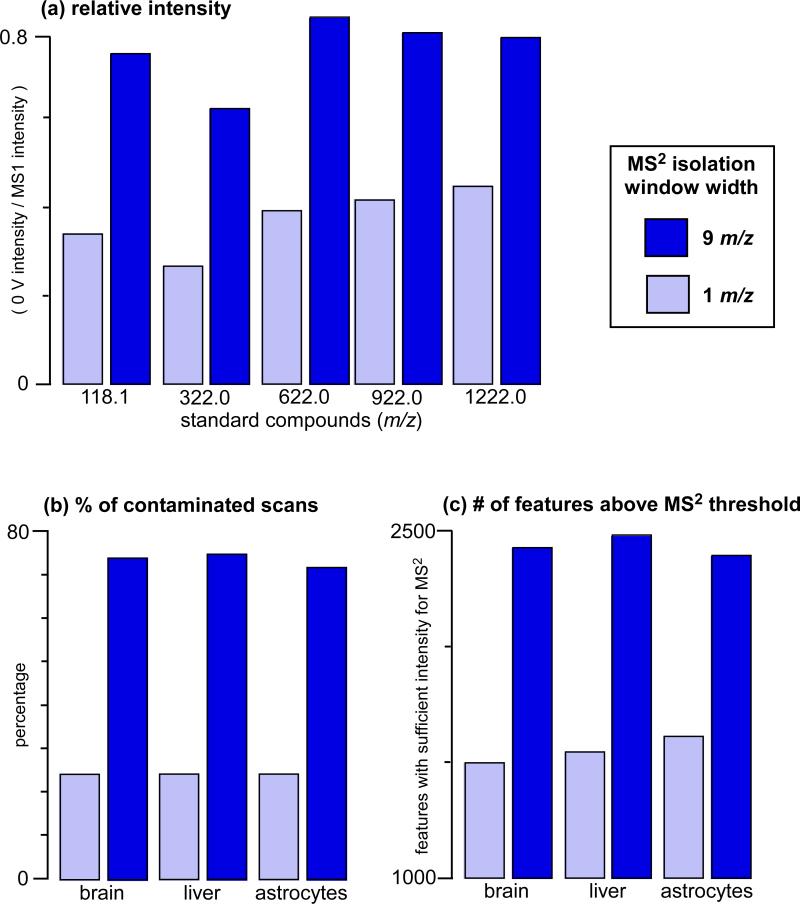
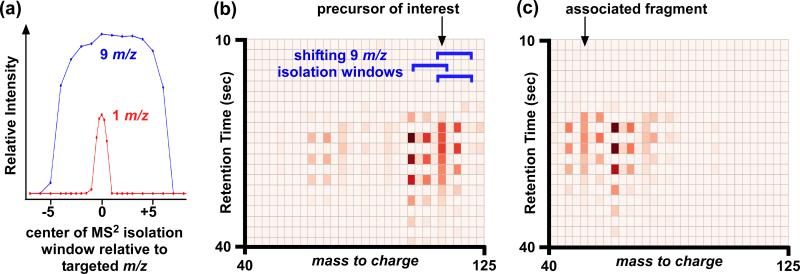
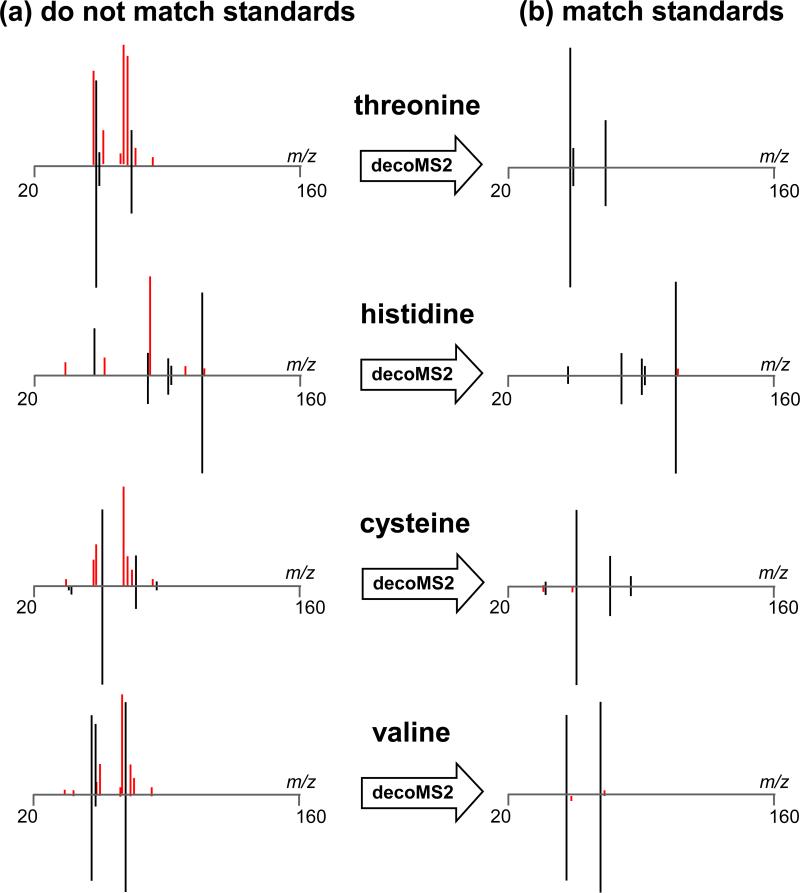
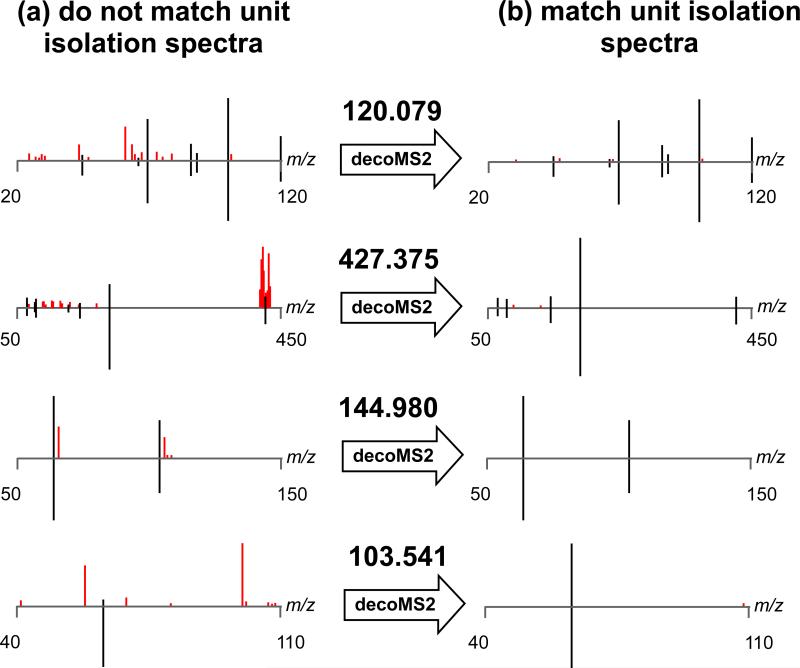
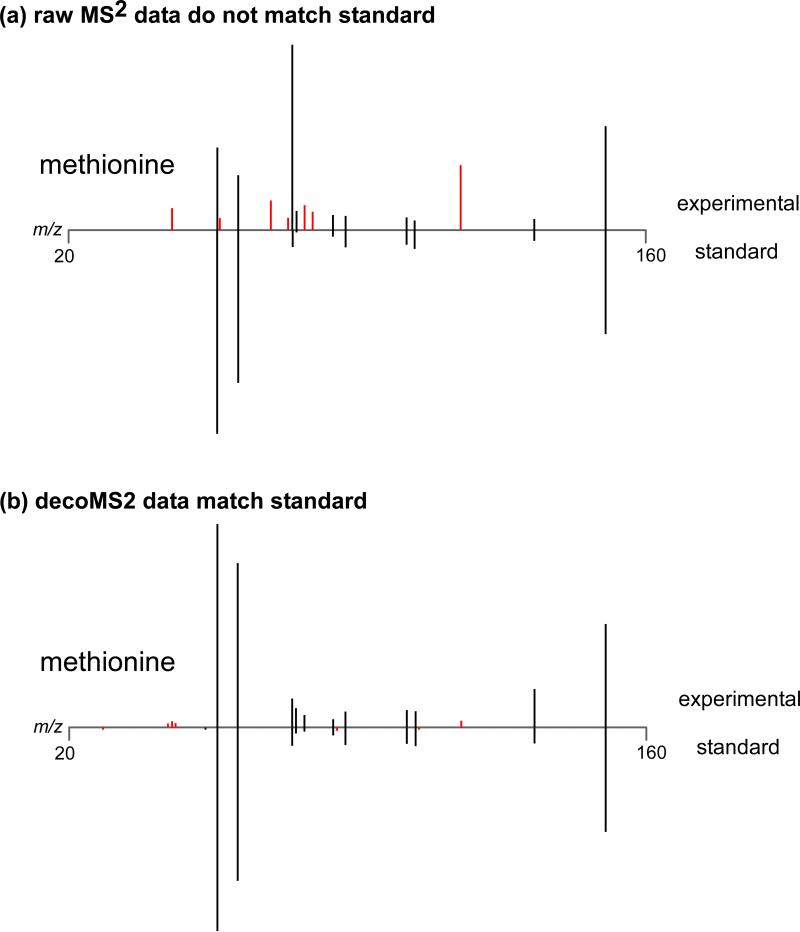
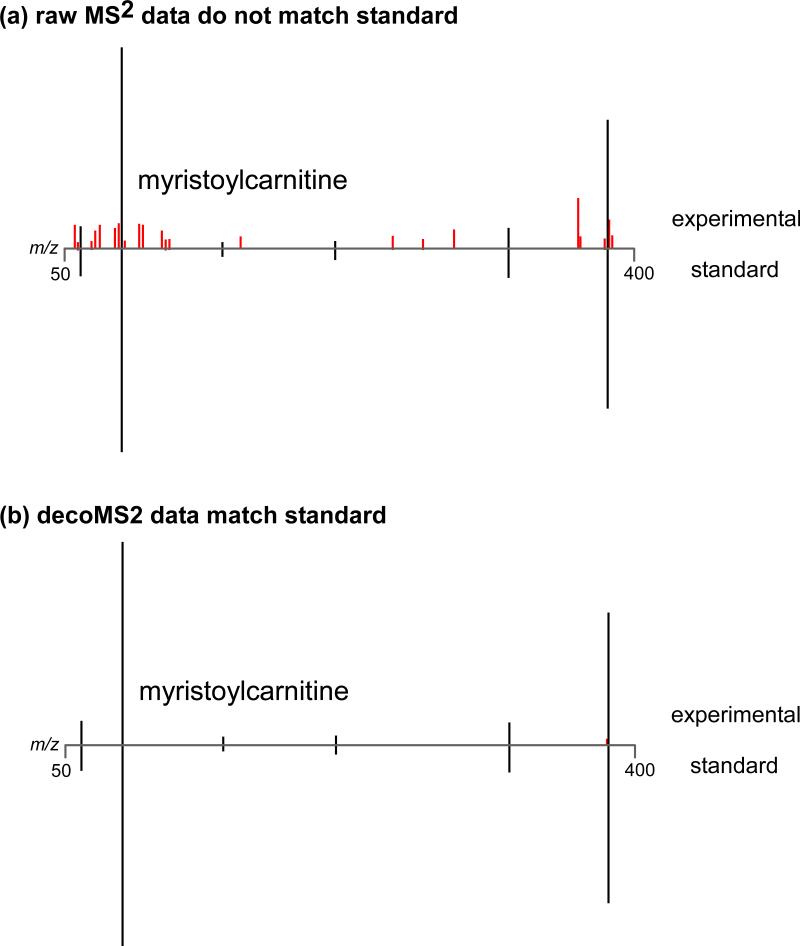
Mass spectrometry-based metabolomics relies on MS(2) data for structural characterization of metabolites. To obtain the high-quality MS(2) data necessary to support metabolite identifications, ions of interest must be purely isolated for fragmentation. Here, we show that metabolomic MS(2) data are frequently characterized by contaminating ions that prevent structural identification. Although using narrow-isolation windows can minimize contaminating MS(2) fragments, even narrow windows are not always selective enough, and they can complicate data analysis by removing isotopic patterns from MS(2) spectra. Moreover, narrow windows can significantly reduce sensitivity. In this work, we introduce a novel, two-part approach for performing metabolomic identifications that addresses these issues. First, we collect MS(2) scans with less stringent isolation settings to obtain improved sensitivity at the expense of specificity. Then, by evaluating MS(2) fragment intensities as a function of retention time and precursor mass targeted for MS(2) analysis, we obtain deconvolved MS(2) spectra that are consistent with pure standards and can therefore be used for metabolite identification. The value of our approach is highlighted with metabolic extracts from brain, liver, astrocytes, as well as nerve tissue, and performance is evaluated by using pure metabolite standards in combination with simulations based on raw MS(2) data from the METLIN metabolite database. A R package implementing the algorithms used in our workflow is available on our laboratory website ( http://pattilab.wustl.edu/decoms2.php ).


Figures

Figure 1
Figure 1. Comparison of MS2 isolation window widths
(a) Effect of MS2 isolation window width on signal intensity. Ions measured are small molecule standards from Agilent's ESI-TOF tuning mix solution. (b) With an MS2 isolation window of 9 m/z, more than 75% of acquired scans have peaks that cannot be purely isolated in the collision cell for MS2 analysis and therefore their MS2 spectra may contain artifacts that hinder metabolite identification. With an MS2 isolation window of 1 m/z, the proportion of acquired scans with peaks that cannot be purely isolated in the collision cell is reduced to ~20%. (c) By using an MS2 isolation window of 9 m/z instead of 1 m/z, sensitivity is improved such that ~900 more metabolite peaks (i.e., features) can be structurally characterized by MS2 analysis.
Figure 2
Figure 2. Basis of deconvolution approach
(a) MS2 isolation window shapes for Agilent 6520 QTOF. Using a larger MS2 isolation window increases the likelihood of isolating more than 1 precursor in the collision cell for MS2 analysis, but also improves the relative intensity of ions transmitted. Representative (b) MS2 at 0 V and (c) MS2 at 20 V data used for deconvolution over a 30 second chromatographic window. Each box in the plots represents a single scan. Peak intensity is denoted by color, with bright red representing the most intense peaks. The blue brackets indicate the position of the 9 Da MS2 isolation window used. Ion intensities that are high and low in alternating scans (i.e., bright red followed by light red) are ions that are included and excluded respectively with shifts in the position of the MS2 isolation window. Our deconvolution approach is based on identifying matching patterns in the MS2 plots at 0 and 20 V. An example of a matched precursor and associated fragment is shown with arrows.
Figure 3
Figure 3. decoMS2 applied to amino acid standards
Amino acid standards were mixed and analyzed by LC/MS2, using a 9 Da MS2 isolation window. Because the amino acid standards were inadequately separated, each of their MS2 spectra were contaminated by additional precursors in the collision cell. (a) The experimental MS2 spectra for 4 representative amino acids are shown on the top of each plot. The standard MS2 spectra for each of these amino acids as obtained from pure model compounds is shown on the bottom. Fragments that match in the 2 spectra are colored black, while fragments that do not match are colored red. (b) After the application of decoMS2, the top experimental MS2 spectra of each amino acid are highly consistent with the MS2 spectra from their respective amino acid standards.
Figure 4
Figure 4. decoMS2 applied to a biological sample
To evaluate the performance of decoMS2 on a large set of metabolites in a biological sample, we identified ions in the metabolic extract of astrocytes that were contaminated when isolated with a 9 Da MS2 isolation window but that were not contaminated when isolated using a 1 Da MS2 isolation window. (a) The experimental MS2 spectra for 4 representative accurate masses as obtained using a 9 Da MS2 isolation window are shown on the top of each plot. The experimental MS2 spectra for the same 4 compounds as obtained using a 1 Da MS2 isolation window is shown on the bottom of each plot. Fragments that match in the 2 spectra are colored black, while fragments that do not match are colored red. (b) After applying decoMS2 to the top spectra using the shifting window approach, the MS2 spectra obtained with a 9 Da MS2 isolation window are in concordance with those MS2 spectra obtained with a 1 Da MS2 isolation window.
Figure 5
Figure 5. decoMS2 applied to methionine from astrocytes
(a) The metabolic extract of astrocytes was analyzed by using the standard metabolomic workflow and MS2 data for methionine were obtained. The raw experimental MS2 spectrum for methionine is shown on top and the MS2 spectrum from a pure standard is shown on bottom. Fragments that match in the 2 spectra are colored black, while fragments that do not match are colored red. The additional fragments in the experimental MS2 spectrum preclude identification of this compound as methionine. (b) After applying decoMS2, the experimental MS2 data matches the MS2 data of the methionine standard and thereby supports the structural assignment.
Figure 6
Figure 6. decoMS2 applied to myristoylcarnitine from peripheral nerve tissue
Peripheral nerve tissue was analyzed from 2 groups of mice using the standard metabolomic workflow. A feature of interest was identified to be dysregulated with statistical significance and was targeted for structural characterization. MS2 data were acquired for the feature and searched in metabolite databases. (a) The raw MS2 spectrum acquired for this feature is shown on top. The accurate mass of the feature was consistent with that of myristoylcarnitine and the MS2 data had similarities to the MS2 data of the myristoylcarnitine standard, which is shown on the bottom. Fragments that match in the 2 spectra are colored black. Fragments that do not match are colored red. Although we hypothesized that this feature of interest in the peripheral nerve tissue may be myristoylcarnitine, the additional fragments in the experimental MS2 spectrum precluded identification and publication of the compound as myristoylcarnitine. (b) After applying decoMS2, the experimental MS2 data matched the MS2 data of the myristoylcarnitine standard and thereby supported the structural assignment.

References

    1. Milne SB, Mathews TP, Myers DS, Ivanova PT, Brown HA. Biochemistry. 2013;52:3829–40. - PMC - PubMed
    1. Vinayavekhin N, Saghatelian A. Curr Protoc Mol Biol. 2010;1:1–24. Chapter 30, Unit 30. - PubMed
    1. Johnson CH, Gonzalez FJ. J Cell Physiol. 2012;227:2975–81. - PMC - PubMed
    1. Lu W, Clasquin MF, Melamud E, Amador-Noguez D, Caudy AA, Rabinowitz JD. Anal Chem. 2010;82:3212–21. - PMC - PubMed
    1. Smith CA, O'Maille G, Want EJ, Qin C, Trauger SA, Brandon TR, Custodio DE, Abagyan R, Siuzdak G. Ther Drug Monit. 2005;27:747–51. - PubMed

Publication types

LinkOut - more resources