

Factors influencing infection by pandemic influenza A(H1N1)pdm09 over three epidemic waves in Singapore
- PMID: 23829633
- PMCID: PMC4634269
- DOI: 10.1111/irv.12129
Factors influencing infection by pandemic influenza A(H1N1)pdm09 over three epidemic waves in Singapore
Abstract
Introduction: Previous influenza pandemics had second and on occasion third waves in many countries that were at times more severe than the initial pandemic waves.
Objective: This study aims to determine the seroepidemiology of successive waves of H1N1pdm09 infections in Singapore and the overall risks of infection.
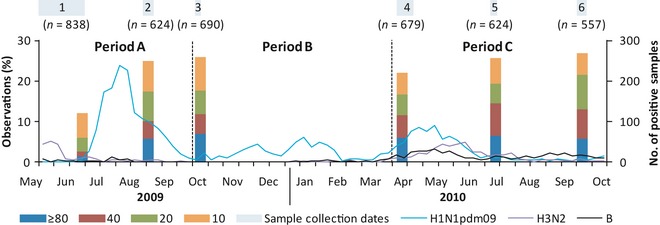
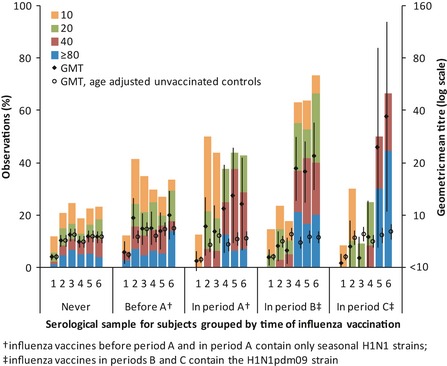
Methods: We performed a cohort study amongst 838 adults, with blood samples provided upon recruitment and at 5 points from 2009 to 2011 and tested by haemagglutination inhibition (HI) with A/California/7/2009 (H1N1pdm09). Surveys on key demographic and clinical information were conducted at regular intervals, and associations between seroconversion and these variables were investigated.
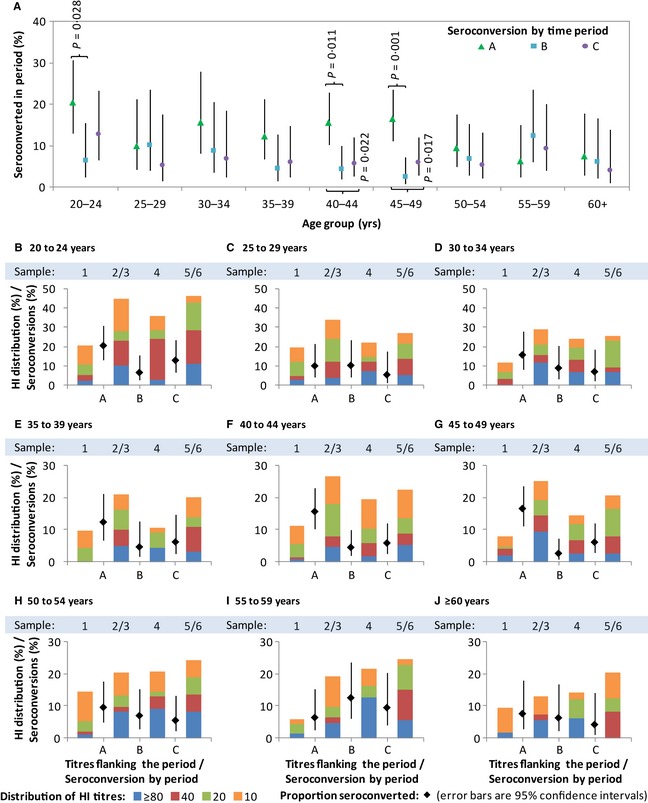
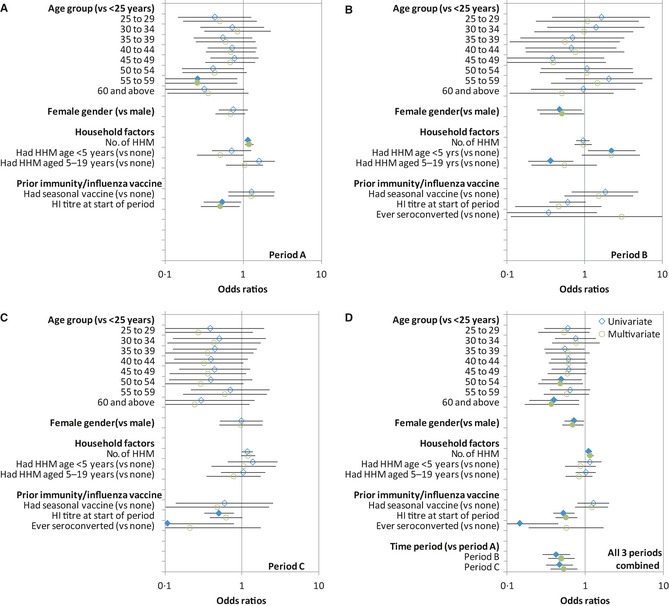
Results: After the initial wave from June to September 2009, second and third waves occurred from November 2009 to February 2010 and April to June 2010, respectively. Seroconversion was 13·5% during the first wave and decreased to 6·2% and 6·8% in subsequent waves. Across the three waves, the elderly and those with higher starting HI titres were at lower risk of seroconversion, while those with larger households were at greater risk. Those with higher starting HI titres were also less likely to have an acute respiratory infection.
Conclusions: The second and third waves in Singapore had lower serological attack rates than the first wave. The elderly and those with higher HI titres had lower risk, while those in larger households had higher risk of seroconversion.
Keywords: Epidemic waves; H1N1pdm09; haemagglutination inhibition; risk factors; seroconversion; seroepidemiology.
© 2013 John Wiley & Sons Ltd.
Figures
References
-
- Viboud C, Grais RF, Lafont BA, Miller MA, Simonsen L. Multinational Influenza Seasonal Mortality Study Group . Multinational impact of the 1968 Hong Kong influenza pandemic: evidence for a smoldering pandemic.J Infect Dis 2005; 192:233–248. - PubMed
-
- Miller MA, Viboud C, Balinska M, Simonsen L. The signature features of influenza pandemics–implications for policy. N Engl J Med 2009; 360:2595–2598. Epub 2009 May 7. - PubMed
-
- WHO Influenza‐like illness in the United States and Mexico: World Health Organization [internet]. 2012. Available at http://www.who.int/csr/don/2009_04_24/en/index.html (Accessed 12 October 2012).
Publication types
MeSH terms
Substances
LinkOut - more resources
Full Text Sources
Other Literature Sources
Medical
Miscellaneous
