. 2013 Jul 5;7(1):16.
doi: 10.1186/1479-7364-7-16.

Rank-based genome-wide analysis reveals the association of ryanodine receptor-2 gene variants with childhood asthma among human populations

Affiliations

Rank-based genome-wide analysis reveals the association of ryanodine receptor-2 gene variants with childhood asthma among human populations

Lili Ding et al. Hum Genomics. .

Abstract

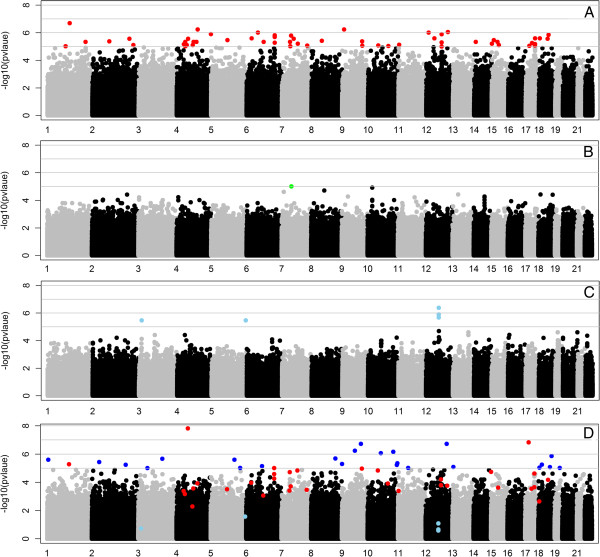
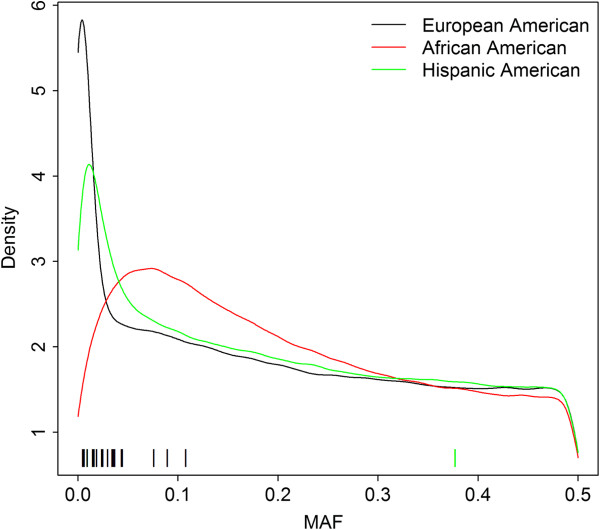
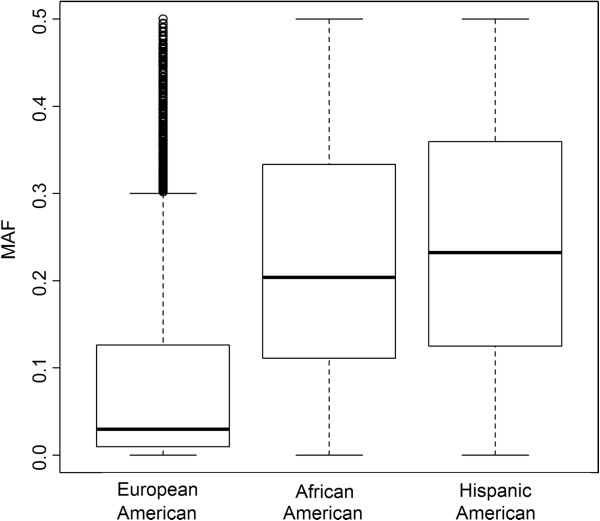
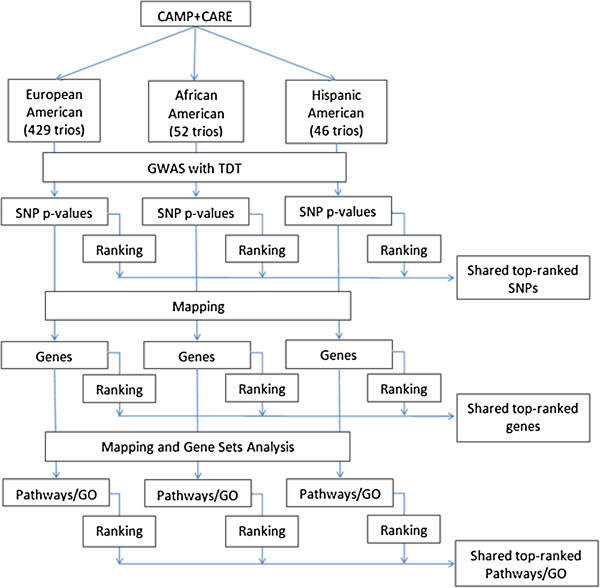
Background: The standard approach to determine unique or shared genetic factors across populations is to identify risk alleles in one population and investigate replication in others. However, since populations differ in DNA sequence information, allele frequencies, effect sizes, and linkage disequilibrium patterns, SNP association using a uniform stringent threshold on p values may not be reproducible across populations. Here, we developed rank-based methods to investigate shared or population-specific loci and pathways for childhood asthma across individuals of diverse ancestry. We performed genome-wide association studies on 859,790 SNPs genotyped in 527 affected offspring trios of European, African, and Hispanic ancestry using publically available asthma database in the Genotypes and Phenotypes database.

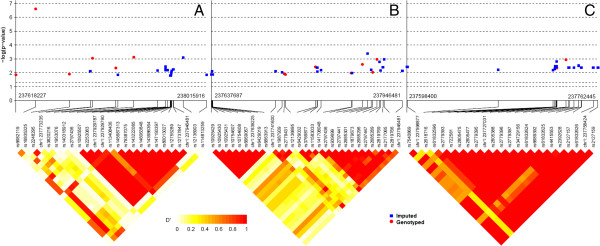
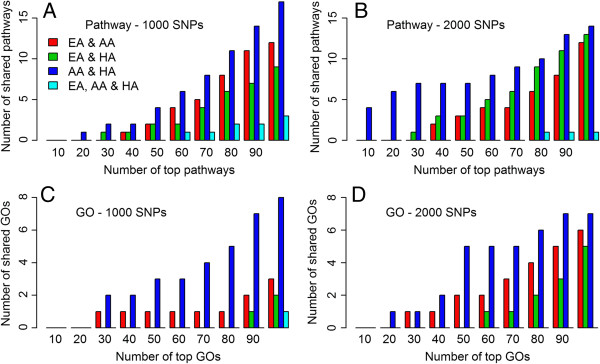
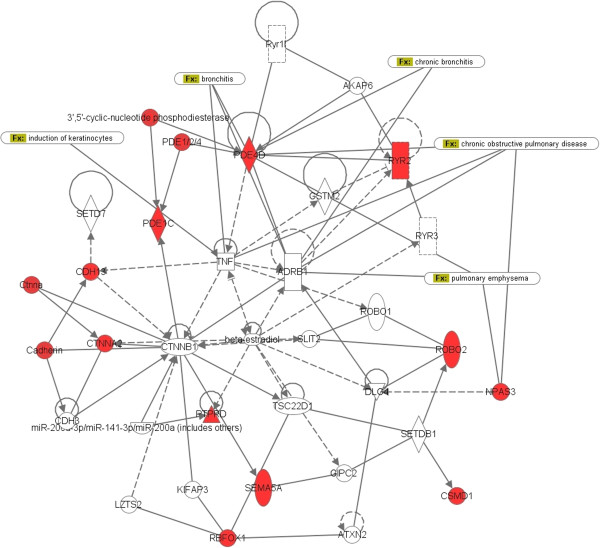
Results: Rank-based analyses showed that there are shared genetic factors for asthma across populations, more at the gene and pathway levels than at the SNP level. Although the top 1,000 SNPs were not shared, 11 genes (RYR2, PDE4D, CSMD1, CDH13, ROBO2, RBFOX1, PTPRD, NPAS3, PDE1C, SEMA5A, and CTNNA2) mapped by these SNPs were shared across populations. Ryanodine receptor 2 (RYR2, a statin response-related gene) showed the strongest association in European (p value=2.55×10(-7)) and was replicated in African (2.57×10(-4)) and Hispanic (1.18 × 10(-3)) Americans. Imputation analyses based on the 1000 Genomes Project uncovered additional RYR2 variants associated with asthma. Network and functional ontology analyses revealed that RYR2 is an integral part of dermatological or allergic disorder biological networks, specifically in the functional classes involving inflammatory, eosinophilic, and respiratory diseases.

Conclusion: Our rank-based genome-wide analysis revealed for the first time an association of RYR2 variants with asthma and replicated previously discovered PDE4D asthma gene across human populations. The replication of top-ranked asthma genes across populations suggests that such loci are less likely to be false positives and could indicate true associations. Variants that are associated with asthma across populations could be used to identify individuals who are at high risk for asthma regardless of genetic ancestry.


Figures

Figure 1
Figure 1
Manhattan plots of the trans-ancestral analysis. (A) European-American, (B) African-American, (C) Hispanic-American population, and (D) all three populations combined. The y-axis displays the negative logarithm of the p value for each SNP marker; the x-axis displays the markers’ genomic coordinates by chromosome. In (A), (B), and (C), colored dots (red for European-Americans, green for African-Americans, and light blue for Hispanic-Americans) indicate markers with p value <1 × 10−5. Among these markers, those that passed inclusion criteria in the mega-sample are also indicated with their respective colors in (D), where the additional markers with p value <1 × 10−5 in the mega-analysis are indicated in blue.
Figure 2
Figure 2
The p value and LD plot of post-imputation RYR2 SNPs for each population. Trans-ancestral analysis of genotyped and imputed association results and LD of the top 1% SNPs of RYR2 after imputation. (A) European-American population, (B) African-American population, and (C) Hispanic-American population.
Figure 3
Figure 3
Overlap of genetic risk factor for childhood asthma across the three populations: At the pathway and GO level. The number of shared pathways (y-axis) among different numbers of top-ranked pathways (x-axis) when the top (A) 1,000 and (B) 2,000 SNPs were declared as noteworthy. The number of shared GO terms (y-axis) among different numbers of top-ranked GO terms (x-axis) when the top (C) 1,000 and (D) 2,000 SNPs were declared as noteworthy. EA, European-American; AA, African-American; HA, Hispanic-American populations.
Figure 4
Figure 4
Density plot of MAF. The MAFs were estimated using the affected offspring. The bars above the x-axis indicate the MAF of SNPs with p value <1 × 10−6 in each population.
Figure 5
Figure 5
Box and whisker plots of MAF of the top 5,000 SNPs for each population. The MAFs were estimated using affected offspring. The bottom and top of the box are the lower and upper quartiles, respectively, the band within the box is the median, and the ends of the whiskers are the lowest/highest data value within 1.5 IQR of the lower/higher quartile. IQR is the difference between the upper and the lower quartiles.
Figure 6
Figure 6
Interactive network of the 11 genes shared among the top 1,000 SNPs of each population. The 11 genes are CDH13, CSMD1, CTNNA2, NPAS3, PDE1C, PDE4D, PTPRD, RBFOX1, ROBO2, RYR2, and SEMA5A. Genes with red nodes represent hub genes in our analysis; others are generated through the network analysis from Ingenuity Pathways Knowledge Base. Edges are displayed with labels that describe the nature of the relationship between the nodes. All edges are supported by at least one reference from the literature or from canonical information stored in the Ingenuity Pathways Knowledge Base. The lines between genes represent known interactions, with solid lines representing direct interactions and dashed lines representing indirect interactions. Nodes are displayed using various shapes that represent the functional class of the gene product.
Figure 7
Figure 7
Work flow diagram. For each population, single-SNP analysis was first conducted using the family-based TDT. SNPs were then mapped to genes, and genes were mapped to pathways/gene sets based on annotation databases. Pathway level associations with childhood asthma were obtained based on gene set analysis. Overlapping and population-specific top-ranked genetic risk factors across the three populations at the locus and pathway levels were studied to investigate shared or unique pathophysiological processes in the study population.

References

    1. Akinbami LJ, Liu X, Pastor PN, Reuben CA. Data from the national health interview survey, 1998–2009. NCHS Data Brief. 2011. pp. 1–8. - PubMed
    1. Barnett SB, Nurmagambetov TA. Costs of asthma in the United States: 2002–2007. J Allergy Clin Immunol. 2011;127(1):145–52. doi: 10.1016/j.jaci.2010.10.020. - DOI - PubMed
    1. Moorman JE, Rudd RA, Johnson CA, King M, Minor P, Bailey C, Scalia MR, Akinbami LJ. National surveillance for asthma–United States, 1980–2004. MMWR Surveill Summ. 2007;56(8):1–54. - PubMed
    1. Maher B. Personal genomes: the case of the missing heritability. Nature. 2008;456(7218):18–21. doi: 10.1038/456018a. - DOI - PubMed
    1. Manolio TA, Collins FS, Cox NJ, Goldstein DB, Hindorff LA, Hunter DJ, McCarthy MI, Ramos EM, Cardon LR, Chakravarti A, Cho JH, Guttmacher AE, Kong A, Kruglyak L, Mardis E, Rotimi CN, Slatkin M, Valle D, Whittemore AS, Boehnke M, Clark AG, Eichler EE, Gibson G, Haines JL, Mackay TF, McCarroll SA, Visscher PM. Finding the missing heritability of complex diseases. Nature. 2009;461(7265):747–53. doi: 10.1038/nature08494. - DOI - PMC - PubMed

Publication types

Substances