. 2013 Jul 18;154(2):311-324.
doi: 10.1016/j.cell.2013.06.026. Epub 2013 Jul 3.

MicroRNA-antagonism regulates breast cancer stemness and metastasis via TET-family-dependent chromatin remodeling

Affiliations

MicroRNA-antagonism regulates breast cancer stemness and metastasis via TET-family-dependent chromatin remodeling

Su Jung Song et al. Cell. .

Abstract

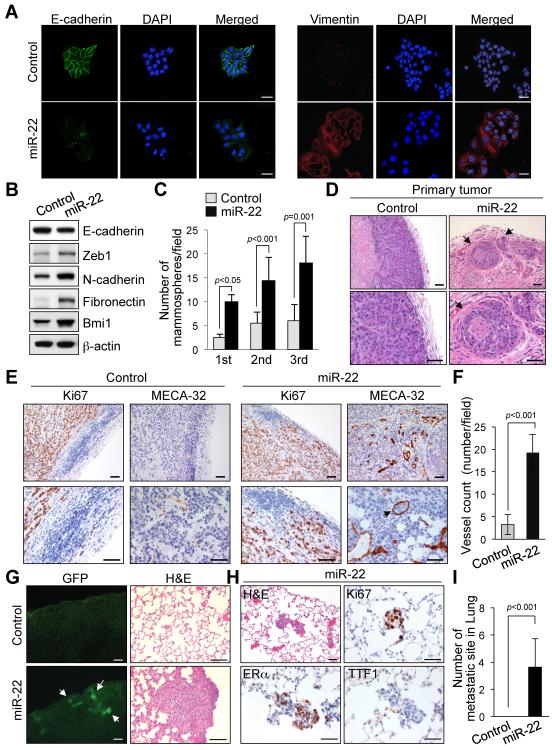
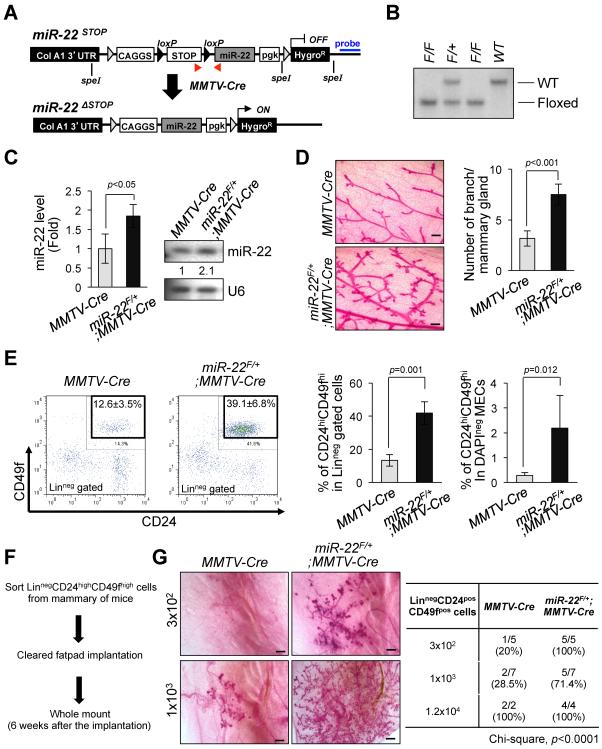
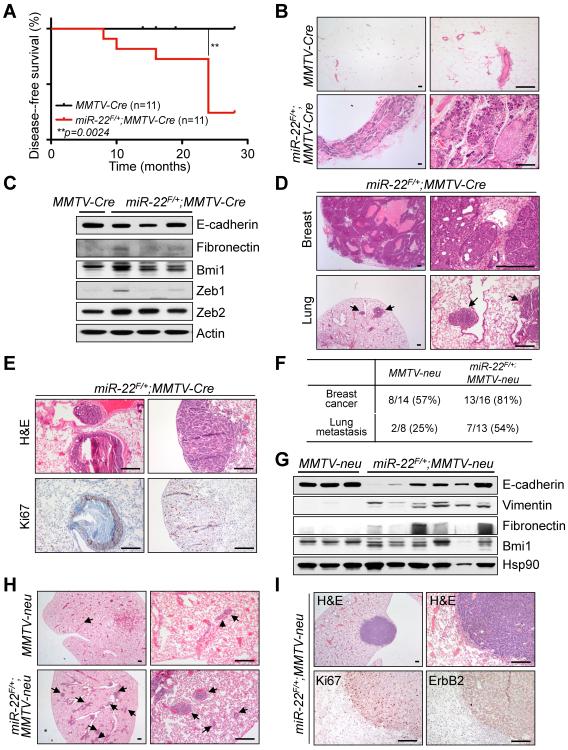
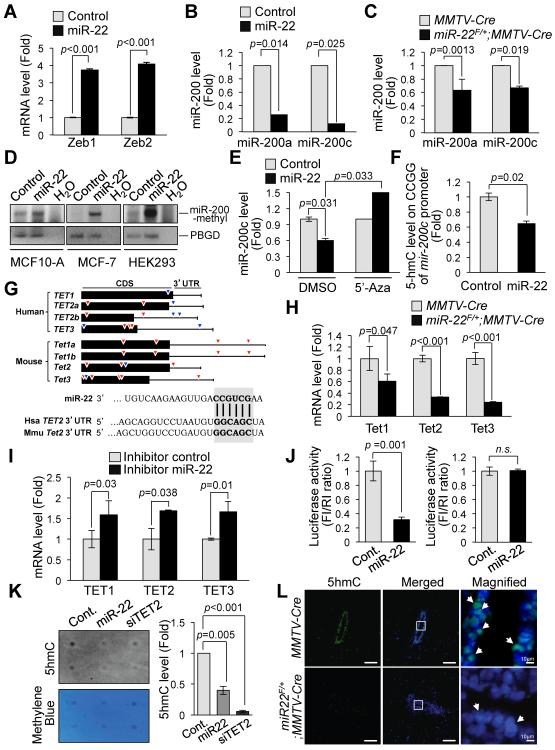
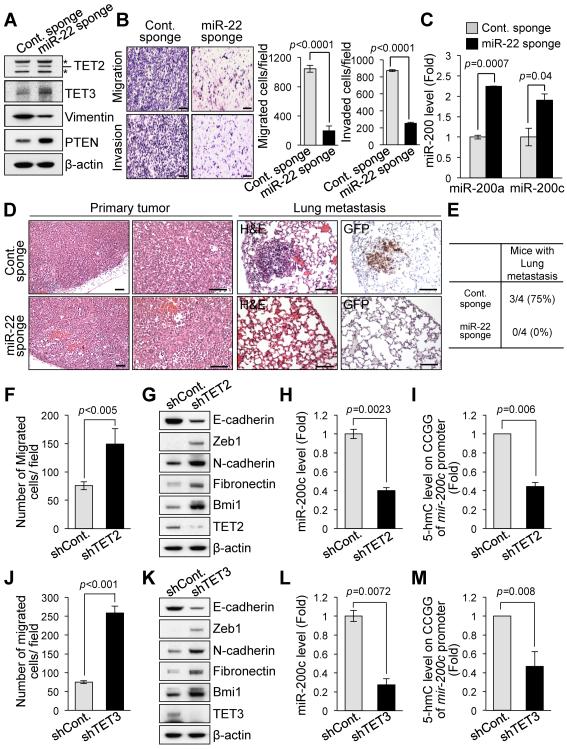
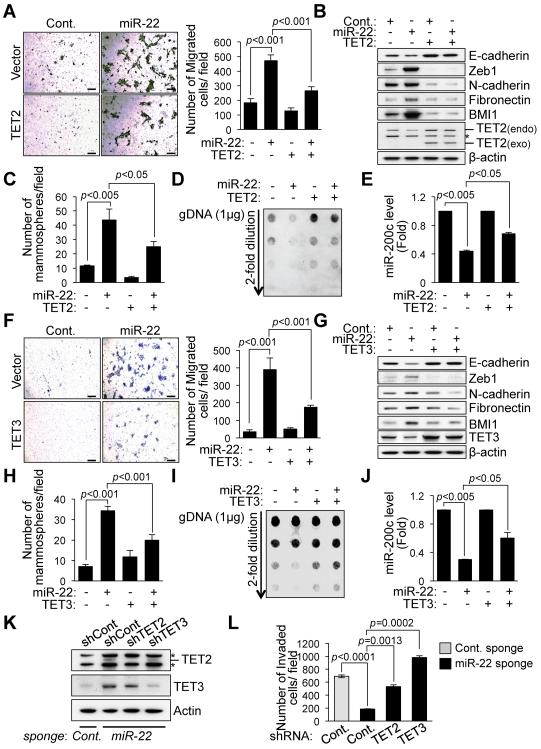
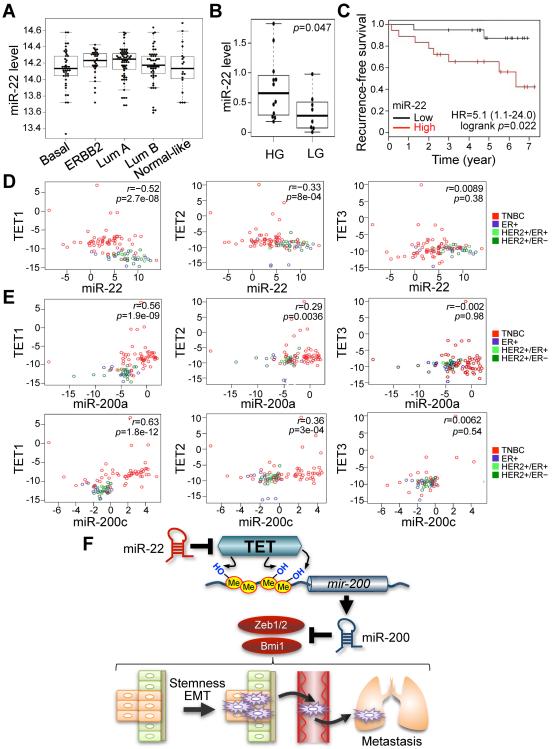
Tumor cells metastasize to distant organs through genetic and epigenetic alterations, including changes in microRNA (miR) expression. Here we find miR-22 triggers epithelial-mesenchymal transition (EMT), enhances invasiveness and promotes metastasis in mouse xenografts. In a conditional mammary gland-specific transgenic (TG) mouse model, we show that miR-22 enhances mammary gland side-branching, expands the stem cell compartment, and promotes tumor development. Critically, miR-22 promotes aggressive metastatic disease in MMTV-miR-22 TG mice, as well as compound MMTV-neu or -PyVT-miR-22 TG mice. We demonstrate that miR-22 exerts its metastatic potential by silencing antimetastatic miR-200 through direct targeting of the TET (Ten eleven translocation) family of methylcytosine dioxygenases, thereby inhibiting demethylation of the mir-200 promoter. Finally, we show that miR-22 overexpression correlates with poor clinical outcomes and silencing of the TET-miR-200 axis in patients. Taken together, our findings implicate miR-22 as a crucial epigenetic modifier and promoter of EMT and breast cancer stemness toward metastasis.


Figures

Figure 1
Figure 1. miR-22 enhances EMT and tumor invasion and metastasis
(A and B) MCF-10A cells infected with the miR-22 expressing or empty vector were subjected to immunofluorescence (A) and Western blot (B) analyses for the indicated proteins. Scale bars, 20 μm. (C) Replating efficiency of mammospheres derived from MCF-10A cells expressing miR-22 was measured. The number of mammospheres per 1000-plated cells in each culture was then quantified. The data are represented as mean ± SD from three independent experiments. (D–F) H&E-stained sections of primary mammary tumors formed by MCF-7 cells expressing miR-22, at 12 weeks after orthotopic transplantation. Arrows indicate areas of lymphatic invasion. Scale bars, 50 μm. (E and F) Ki67- and MECA-32–stained sections of primary mammary tumors formed by MCF-7 cells expressing miR-22 (E). Arrows indicate tumor cells within a vessel. Scale bars, 50 μm. The quantification of vessel numbers (using MECA-32–stained sections) at the center and the edge of the primary mammary tumors is also shown (F) (n=6). (G) GFP images (left) and H&E staining (right) of lungs isolated from mice that received orthotopic injection of MCF-7 cells expressing miR-22, at 12 weeks after transplantation. Arrow indicates clusters of metastatic cells. Scale bars, 100 μm. (H and I) H&E-, Ki67-, ERα- and TTF1-stained sections of lungs isolated from mice that received orthotopic injection of MCF-7 cells expressing miR-22, at 12 weeks after transplantation (H). Scale bars, 50 μm. The number of lung micrometastases (micromets) per section in individual mice was also quantified (I) (n=6). “see also Figures S1A–S1G”.
Figure 2
Figure 2. miR-22 increases mammary gland side-branching and stemness in vivo in transgenic mice
(A) Schematic representation of the strategy for generation of floxed miR-22 mouse embryonic stem cells. Red arrows indicate the positions of primers used for genotyping the miR-22 transgenic mice. Blue line indicates the position of probe for the Southern blot analysis. The F1 floxed miR-22 founder mice were bred to MMTV-Cre strain to delete LoxP site. (B) Genomic DNAs were isolated from the tails of miR-22-LoxP mice were digested by Spe I and subjected to Southern blot analysis. (C) Total RNAs isolated from mammary gland tissues of miR-22F/+;MMTV-Cre mice were subjected to real-time qPCR (left) (n=4) or Northern blot analysis (right) to evaluate miR-22 expression. (D) Whole mount analyses were conducted on 7-weeks old miR-22F/+;MMTV-Cre mice and MMTV-Cre littermates (left) and the number of mammary gland side-branches was quantified (right) (n=3). Scale bars, 500 μm. (E) Distribution of CD45negCD31negCD140anegTer119neg mouse mammary cells according to their expression of CD24 and CD49f were analyzed on 7-weeks old miR-22F/+;MMTV-Cre mice and littermate controls (left). Mouse mammary stem cells (MSCs) according to their expression of CD24highCD49high in Lineagenegative (middle) or total mammary epithelial cells (right) were quantified by a flow cytometric analysis (n=4). (F and G) Schematic representation of limiting dilution transplantation experiments with CD24highCD49fhigh MSCs (F). 3 × 10², 1 × 10³ or 1.2 × 10⁴ LinnegCD24highCD49high MSCs isolated from 7-weeks old miR-22F/+;MMTV-Cre mice and littermate controls were injected into the cleared fat-pad of 3-weeks old FVB/NJ female mice and whole mount analyses were then conducted at 6 weeks after injection (G). Representative images of mammary gland side-branches are shown in the left panel. The resulting data were also analyzed by Chi-square test (right). “see also Figures S1H–S1J”.
Figure 3
Figure 3. miR-22 induces mammary tumorigenesis and metastasis in vivo in transgenic mice
(A) Cumulative disease-free survival analysis. A statistically significant decrease in lifespan for the miR-22F/+;MMTV-Cre cohort was found compared with the MMTV-Cre cohort (p=0.0024, n=11). (B) H&E-stained sections of diffuse alveolar and ductal hyperplasia isolated from 12-months old miR-22F/+;MMTV-Cre mice. Scale bars, 200 μm. (C) Lysates from mammary tumors of miR-22F/+;MMTV-Cre mice were subjected to Western blot analysis for the indicated proteins. (D and E) H&E-stained sections of primary mammary tumors and lungs isolated from 8-months old post-pregnant miR-22F/+;MMTV-Cre mice (D). Arrows indicate clusters of metastatic cells in the lung. Scale bars, 200 μm. H&E- and Ki67-stained sections of lungs isolated from miR-22F/+;MMTV-Cre mice are also shown (E). Scale bars, 200 μm. (F) The incidence of metastases to the lung in MMTV-neu;miR-22F/+;MMTV-Cre (represented as miR-22F/+;MMTV-neu) and MMTV-neu littermates (8~16 months old) was quantified. (G) Lysates from mammary tumors of miR-22F/+;MMTV-neu were subjected to Western blot analysis for the indicated proteins. (H and I) H&E-stained sections of the lungs isolated from miR-22F/+;MMTV-neu mice and littermate controls (H). Arrows indicate clusters of metastatic cells in the lung. Scale bars, 200 μm. H&E-, Ki67- and ErbB2-stained sections of lungs isolated from miR-22F/+;MMTV-neu mice are also shown (I). Scale bars, 200 μm. “see also Figure S2”.
Figure 4
Figure 4. miR-22 regulates epigenetic inactivation of miR-200 and directly targets TET methylcytosine dioxygenases
(A and B) Real-time qPCR analysis of Zeb1/Zeb2 (A) or miR-200a/miR-200c (B) with RNAs from MCF-10A cells infected with the miR-22 expressing or empty vector. The data are represented as mean ±SD from three independent experiments. (C) Real-time qPCR analysis of miR-200a/miR-200c with RNAs obtained from miR-22F/+;MMTV-Cre mice and littermate controls. The data are represented as mean ±SD (n=3). (D) Methylation-specific PCR analysis of mir-200c CpG islands with genomic DNAs purified from the indicated cells infected with the miR-22 expressing vector. (E) Restored miR-200c expression upon treatment with DNA demethylating agent 5'-aza-2'-deoxycytidine (5'-Aza) in MCF-10A cells infected with the miR-22 expressing vector. The data are represented as mean ±SD. (F) GlucMS-qPCR analysis of CpG islands within the mir-200c promoter regions specifically enriched for 5-hydroxymethylcytosine (5hmC) in MCF-10A cells infected with the miR-22 expressing vector. The data are represented as mean ±SD. (G) Representative seed sequences for miR-22 on the TET family: 7 base pairs (red-colored) and 8 base pairs (blue-colored) on human and mouse TET family (top) and seed match sequences of miR-22 within 3'UTR of human and mouse TET2b as an example (bottom) are shown. (H) Total RNAs isolated from primary mammary epithelial cells of miR-22F/+;MMTV-Cre mice or littermate controls were subjected to real-time qPCR for Tet1, Tet2 and Tet3 mRNA. The data are represented as mean ±SD (n=3). (I) Total RNAs isolated from MCF-10A cells transfected with the inhibitor (decoy) of miR-22 were subjected to real-time qPCR for TET1, TET2 and TET3 mRNA. The data are represented as mean ±SD. (J) Luciferase assay of the luciferase gene linked to the 3'UTR of TET2. HEK293 cells were transiently transfected with a combination of pGL3 firefly luciferase reporter plasmids encoding wild-type (left) or mutated (right) 3'UTR sequences of human TET2b, miR-22 and a Renilla luciferase reporter for normalization. The data are represented as mean ±SD. (K) Genomic DNA purified from HEK293 cells expressing control miRNA, miR-22 or TET2 siRNA was denatured and neutralized. Global 5hmC levels were then measured by using a dot blot assay with anti-5hmC antibody and normalized by methylene blue staining (left). The resulting 5hmC levels were also quantified (right). (L) 5hmC- and DAPI-stained sections of the duct of mammary glands isolated from 7-weeks old miR-22F/+;MMTV-Cre mice or littermate controls. Scale bar, 100 μm. The arrows indicate the cells with strong 5hmC positive signals. “see also Figure S3”.
Figure 5
Figure 5. Loss of miR-22 or TET family members alters EMT, stemness and miR-200 levels
(A) Cell lysates from LM2 cells infected with the control or miR-22 sponge were subjected to Western blot analysis for the indicated proteins. PTEN protein was used as a verified miR-22 target to show the efficacy of the miR-22 sponge in this analysis. (B) LM2 cells infected with the miR-22 sponge were subjected to the cell migration (top) and invasion assay (bottom). Representative fields of the cells are shown (left). Scale bars, 100 μm. The migrated or invaded cells were also quantified (right). The data are represented as mean ±SD from three independent experiments. (C) Real-time qPCR analysis of miR-200a/miR-200c with RNAs from LM2 cells infected with the miR-22 sponge. The data are represented as mean ±SD. (D and E) H&E-stained sections of primary mammary tumors (left), or H&E-stained and Ki67-stained sections of lungs isolated from mice that received orthotopic injection of control- or miR-22 sponge-infected LM2 cells (right) (D). Scale bars, 100 μm. The incidence of metastases to the lung in mice at 10 weeks after orthotopic injection is also shown (E). (F and J) MCF-10A cells infected with the lentiviral vector expressing TET2 (F) or TET3 (J) shRNA were subjected to the cell migration assay and the migrated cells were then quantified. The data are represented as mean ±SD. (G and K) Cell lysates from MCF-10A cells expressing TET2 (G) or TET3 (K) shRNA were subjected to Western blot analysis for the indicated proteins. (H and L) Real-time qPCR analysis of miR-200c with RNAs from MCF-10A cells expressing TET2 (H) or TET3 (L) shRNA. The data are represented as mean ±SD. (I and M) GlucMS-qPCR analysis of CpG islands within the mir-200c promoter regions specifically enriched for 5hmC in MCF-10A cells expressing TET2 (I) or TET3 (M) shRNA. The data are represented as mean ±SD. “see also Figures S4A–S4F”.
Figure 6
Figure 6. TET family members are required for miR-22-induced EMT, stemness and miR-200 repression
(A and F) MCF-10A cells infected with a combination of the miR-22, TET2b (A) and TET3 (F) expressing vector were subjected to the cell migration assay. Representative fields of the migrated cells are shown (left). Scale bars, 100 μm. The migrated cells were also quantified (right). The data are represented as mean ±SD from three independent experiments. (B and G) Cell lysates from MCF-10A cells expressing a combination of the miR-22, TET2b (B) and TET3 (G) were subjected to Western blot analysis for the indicated proteins. Asterisk indicates non-specific band. (C and H) Mammospheres derived from MCF-10A cells expressing a combination of the miR-22, TET2b (C) and TET3 (H) were measured. The number of mammospheres per 1000-plated cells in each culture was then quantified. The data are represented as mean ±SD. (D and I) Genomic DNA purified from MCF-10A cells expressing a combination of the miR-22, TET2b (D) and TET3 (I) was denatured and neutralized. Global 5hmC levels were then measured by a dot blot assay using anti-5hmC antibody. (E and J) Real-time qPCR analysis of miR-200c with RNAs from MCF-10A cells expressing a combination of the miR-22, TET2b (E) and TET3 (J). The data are represented as mean ±SD. (K and L) LM2 cells infected with a combination of the control and miR-22 sponge and the TET2 or TET3 shRNA expressing vector were subjected to Western blot analysis for the indicated proteins (K) and the cell invasion assay (L). Asterisk indicates non-specific band. The data are represented as mean ±SD. “see also Figures S4G and S4H”.
Figure 7
Figure 7. miR-22 overexpression correlates with poor clinical outcomes and silencing of the TET-miR-200 axis in patients
(A) miR-22 expression profiling was analyzed from a previously published Illumina Human RefSeq-8 and miRNAv1 array dataset (superSeries GSE22220). Breast tumors were classified by molecular subtypes, estrogen receptor (ER), progesterone receptor (PR), ERBB2 (HER-2) and epithelial clusters. (B) miR-22 expression was analyzed by using a real-time qPCR with RNAs from human breast cancer patient samples. Tumor grade was determined by the parameters, ER, PR, ERBB2 (HER-2) and epithelial clusters. HG, ER-positive high-grade tumors; LG, ER-positive low-grade tumors. (C) Non triple-negative breast cancer (TNBC) patient samples were sub-divided into two groups according to low and high expression of miR-22 with median split of all samples. A Kaplan-Meier plot representing the disease-free survival of patients was stratified. (D) Anti-correlation between miR-22 and TET family expressions was analyzed using a real-time qPCR with RNAs from breast cancer patient samples. (E) Co-expression analysis of TET family and miR-200a/miR-200c was analyzed by using a real-time qPCR with RNAs from breast cancer patient samples. (F) Proposed model of the role of miR-22 for EMT, stemness and metastasis through epigenetic inactivation of miR-200 by directly targeting the TET family. miR-22 decreases the level of 5hmC by negatively regulating TET family, followed by epigenetic inactivation of miR-200 due to the reduced 5hmC levels. Ultimately, dysfunction of miR-200 triggers EMT and stemness, which in turn increases mammary tumorigenesis and metastasis. “see also Figure S5 and Table S1”.

Comment in

References

    1. Adam L, Zhong M, Choi W, Qi W, Nicoloso M, Arora A, Calin G, Wang H, Siefker-Radtke A, McConkey D, et al. miR-200 expression regulates epithelial-to-mesenchymal transition in bladder cancer cells and reverses resistance to epidermal growth factor receptor therapy. Clin. Cancer Res. 2009;15:5060–5072. - PMC - PubMed
    1. Bartel DP. MicroRNAs: genomics, biogenesis, mechanism, and function. Cell. 2004;116:281–297. - PubMed
    1. Bendoraite A, Knouf EC, Garg KS, Parkin RK, Kroh EM, O'Briant KC, Ventura AP, Godwin AK, Karlan BY, Drescher CW, et al. Regulation of miR-200 family microRNAs and ZEB transcription factors in ovarian cancer: evidence supporting a mesothelial-to-epithelial transition. Gynecol. Oncol. 2010;116:117–125. - PMC - PubMed
    1. Betel D, Wilson M, Gabow A, Marks DS, Sander C. The microRNA.org resource: targets and expression. Nucleic Acids Res. 2008;36:D149–153. microRNA.org - PMC - PubMed
    1. Bierie B, Moses HL. Tumour microenvironment: TGFbeta: the molecular Jekyll and Hyde of cancer. Nat. Rev. Cancer. 2006;6:506–520. - PubMed

Publication types

MeSH terms