Case Reports
. 2013 Dec;120(12):2656-2665.
doi: 10.1016/j.ophtha.2013.05.029. Epub 2013 Jul 4.

Optical coherence tomography-based observation of the natural history of drusenoid lesion in eyes with dry age-related macular degeneration

Affiliations
Case Reports

Optical coherence tomography-based observation of the natural history of drusenoid lesion in eyes with dry age-related macular degeneration

Yanling Ouyang et al. Ophthalmology. 2013 Dec.

Abstract

Purpose: To use spectral domain optical coherence tomography (SD-OCT) to investigate risk factors predictive for the development of atrophy of drusenoid lesions (DLs) (drusen and drusenoid pigment epithelium detachment) in eyes with non-neovascular age-related macular degeneration (NNVAMD).

Design: Cohort study.

Participants: Forty-one eyes from 29 patients with NNVAMD.

Methods: Patients with NNVAMD who underwent registered SD-OCT imaging over a minimum period of 6 months were reviewed. Drusenoid lesions that were accompanied by new atrophy onset at 6 months or last follow-up (FUL) were further analyzed. Detailed lesion change was described throughout the study period. Odds ratios (ORs) and risk for new local atrophy onset were calculated.

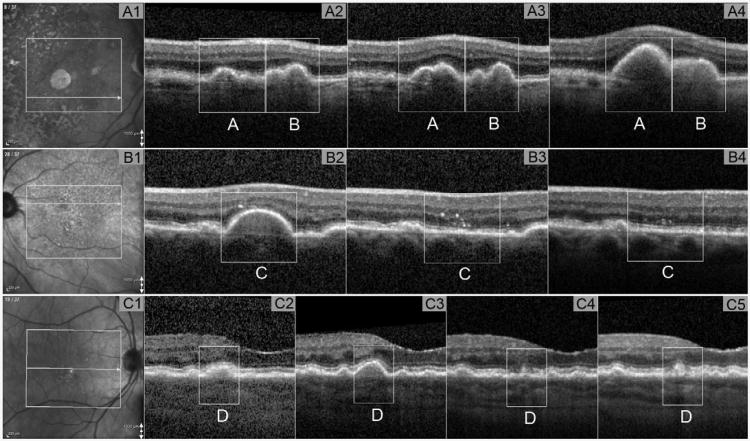
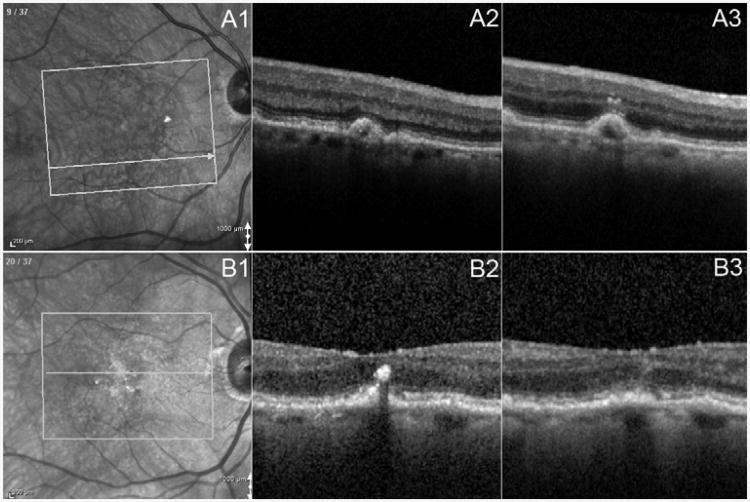
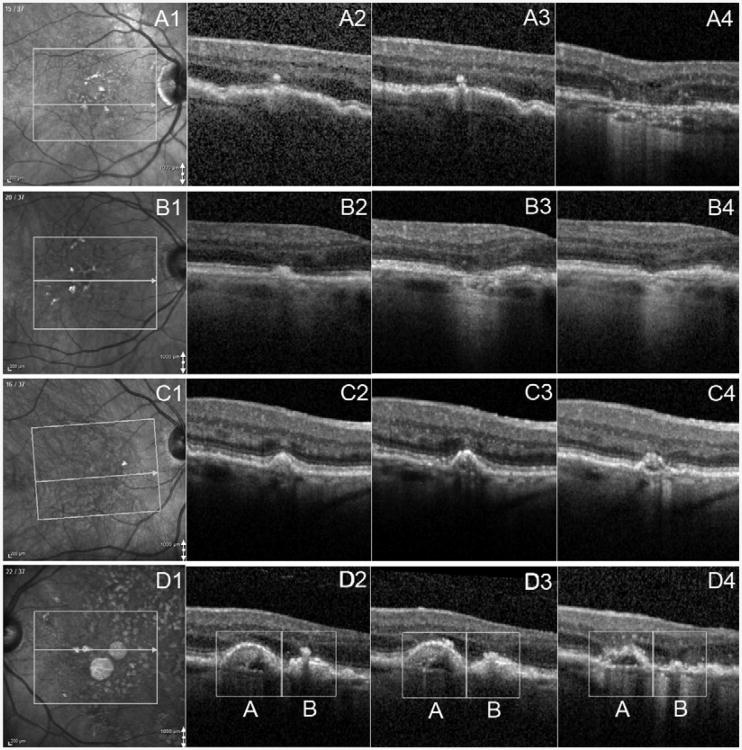
Main outcome measures: Drusenoid lesion features and longitudinal changes in features, including maximum lesion height, lesion diameter, lesion internal reflectivity, and presence and extent of overlying intraretinal hyperreflective foci (HRF). Subfoveal choroidal thickness (SFCT) and choroidal thickness (CT) were measured below each lesion.

Results: A total of 543 individual DLs were identified at baseline, and 28 lesions developed during follow-up. The mean follow-up time was 21.3±8.6 months (range, 6-44 months). Some 3.2% of DLs (18/571) progressed to atrophy within 18.3 ± 9.5 months (range, 5-28 months) of the initial visit. Drusenoid lesions with heterogeneous internal reflectivity were significantly associated with new atrophy onset at 6 months (OR, 5.614; 95% confidence interval [CI], 1.277-24.673) and new atrophy onset at FUL (OR, 7.005; 95% CI, 2.300-21.337). Lesions with the presence of HRF were significant predictors of new atrophy onset at 6 months (OR, 30.161; 95% CI, 4.766-190.860) and FUL (OR, 11.211; 95% CI, 2.513-50.019). Lesions with a baseline maximum height >80 μm or CT ≤ 135 μm showed a positive association with the new atrophy onset at FUL (OR, 7.886; 95% CI, 2.105-29.538 and OR, 3.796; 95% CI, 1.154-12.481, respectively).

Conclusions: The presence of HRF overlying DLs, a heterogeneous internal reflectivity of these lesions, was found consistently to be predictive of local atrophy onset in the ensuing months. These findings provide further insight into the natural history of anatomic change occurring in patients with NNVAMD.


Figures

Figure 1
Figure 1. Example of change of maximum height of drusenoid lesion seen by SD-OCT
Part A: example of MaxH increase. Part A1: Infrared image showing B-scan location on the fundus at baseline. Part A2-A4: OCT B-scans where MaxH of DL(A) and DL(B) located. Part A2: MaxH for DL (A) = 96 microns, MaxH for DL (B) =93 microns at baseline. Part A3: MaxH for DL (A) =119 microns, MaxH for DL (B) =81 microns at 6m after baseline. Part A4: MaxH for DL (A) =303 microns, MaxH for DL (B) =132 microns at 27m after baseline. Part B: example of MaxH decrease. Part B1: Infrared image showing B-scan location on the fundus at baseline. Part B2-B4: OCT B-scans where MaxH of DL(C) located. Part B2: MaxH for DL (C) =197 microns at baseline. Part B3: MaxH for DL (C) decreased to 0 microns at 10m after baseline. Part B4: MaxH for DL (C) remained at 0 microns at 15m after baseline. Part C: example of MaxH fluctuated. Part C1: Infrared image showing B-scan location on the fundus at baseline. Part C2-C4: OCT B-scans where MaxH of DL (D) located. Part C2: MaxH for DL (C) =76 microns at baseline. Part C3: MaxH for DL (C) =115 microns at 10m after baseline. Part C4: MaxH for DL (C) =68 microns at 18m after baseline. Part B5: MaxH for DL (C) =87 microns at 44m after baseline. DL = drusenoid lesion; MaxH = maximum height of DL; OCT = optical coherence tomography; SD-OCT = spectral domain OCT; m = month.
Figure 2
Figure 2. Example of change of features of hyper reflective foci seen by SD-OCT
Part A: example of HRF increase. Part A1: Infrared image showing B-scan location on the fundus at baseline. Part A2: OCT B-scan showing absent HRF related to DL at baseline. No HRF related to the same DL was found in any other B-scan. Part A3: OCT B-scan showing definite HRF present related to DL at 7m after baseline. LHRF was graded as inner nuclear layer. Part B: example of HRF decrease. Part B2: OCT B-scan showing definite HRF present related to DL at baseline. LHRF was graded as outer nuclear layer. Part B3: OCT B-scan showing absent HRF related to DL at 9m after baseline. No HRF was found in any B-scan related to the same DL. DL = drusenoid lesion; HRF = Hyper Reflective Foci; LHRF = layer of HRF; OCT = optical coherence tomography; SD-OCT = spectral domain OCT; m=month.
Figure 5
Figure 5. Case Examples of New Atrophy Onset seen by SD-OCT
Part A: example of new atrophy onset related to HRF. Part A1: Infrared image showing B-scan location on the fundus at baseline. Part A2: OCT B-scan showing definite HRF related to DL without evidence of atrophy at baseline. Part A3: OCT B-scan showing definite HRF without atrophy at 2m after baseline. Part A4: OCT B-scan showing definite atrophy with HRF at 28 months after baseline. Part B: example of new atrophy onset related to homogeneous DL. Part B1: Infrared image showing B-scan location on the fundus at baseline. Part B2: OCT B-scan showing absent atrophy at baseline IRDL as homogeneous. Part B3: OCT B-scan showing clearance of DL but presence of atrophy at the same location at 9m after baseline. HRF was also noted in the outer nuclear layer. Part B4: OCT B-scan showing atrophy at 21m after baseline without evidence of HRF. Part C: example of new atrophy onset related change of IRDL. Part C1: Infrared image showing B-scan location on the fundus at baseline. Part C2: OCT B-scan showing IRDL graded as homogeneous. Part C3: OCT B-scan showing IRDL changed to heterogeneous without presence of atrophy at 9m after baseline. Part C4: OCT B-scan showing presence of new atrophy at 21m after baseline. Part D: example of new atrophy onset related HRF and IRDL. Part D1: Infrared image showing B-scan location on the fundus at baseline. Part D2: OCT B-scan showing DL (A) and DL (B) both with IRDL as heterogeneous. DL (B) had definite HRF while DL (A) had not. Part D3: OCT B-scan showing DL (A) with new HRF present at 11m after baseline. Part D4: OCT B-scan showing presence of new atrophy for both DL (A) and DL (B) at 27m after baseline. DL = drusenoid lesion; IRDL = Internal Reflectivity of DL; HRF = hyper reflective foci; OCT = optical coherence tomography; SD-OCT = spectral domain OCT; m=month.

References

    1. Gregori G, Wang F, Rosenfeld PJ, et al. Spectral domain optical coherence tomography imaging of drusen in nonexudative age-related macular degeneration. Ophthalmology. 2011;118:1373–9. - PMC - PubMed
    1. Bird AC, Marshall J. Retinal pigment epithelial detachments in the elderly. Transactions of the ophthalmological societies of the United Kingdom. 1986;105(6):674–82. - PubMed
    1. Roquet W, Roudot-Thoraval F, Coscas G, Soubrane G. Clinical features of drusenoid pigment epithelial detachment in age related macular degeneration. British Journal of Ophthalmology. 2004;88:638–642. - PMC - PubMed
    1. Casswell AG, Kohen D, Bird AC. Retinal pigment epithelial detachments in the elderly: classification and outcome. The British journal of ophthalmology. 1985;69:397–403. - PMC - PubMed
    1. Zweifel SA, Imamura Y, Spaide TC, et al. Prevalence and significance of subretinal drusenoid deposits (reticular pseudodrusen) in age-related macular degeneration. Ophthalmology. 2010;117:1775–81. - PubMed

Publication types