. 2013 Jul 24;79(2):322-34.
doi: 10.1016/j.neuron.2013.05.012. Epub 2013 Jul 3.

Intersecting circuits generate precisely patterned retinal waves

Affiliations

Intersecting circuits generate precisely patterned retinal waves

Alejandro Akrouh et al. Neuron. .

Abstract

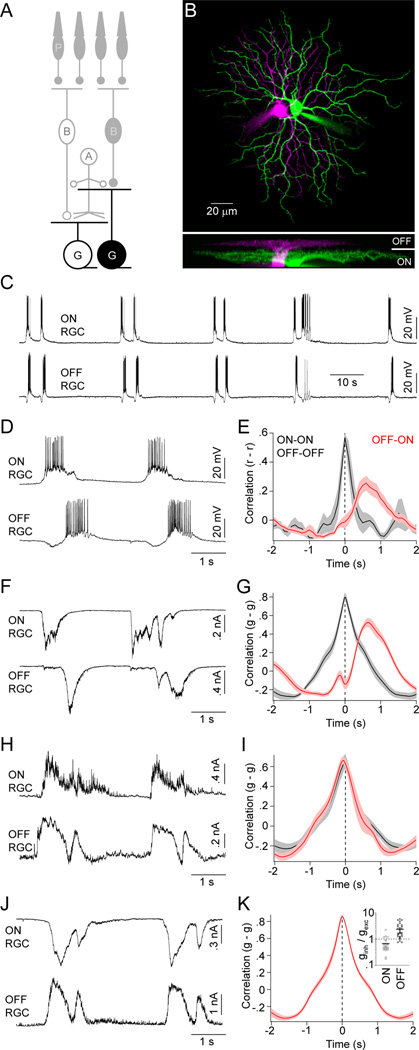
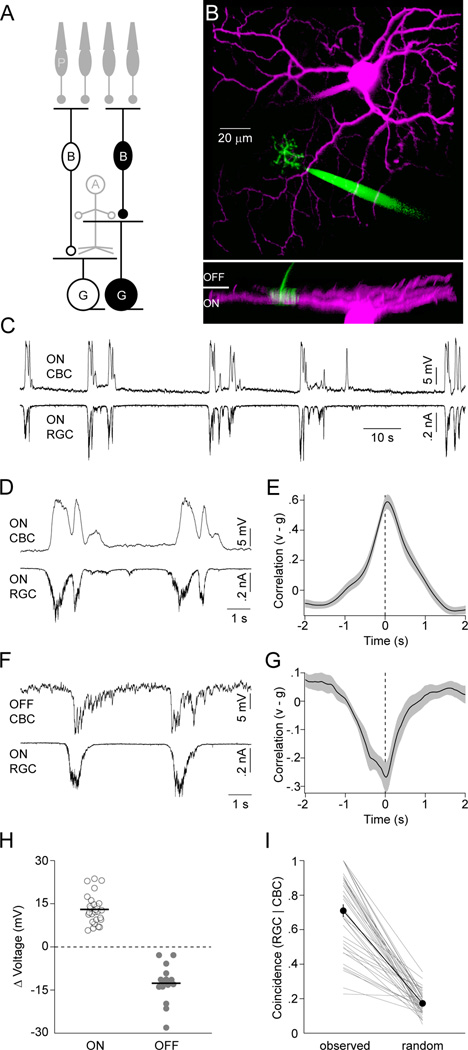
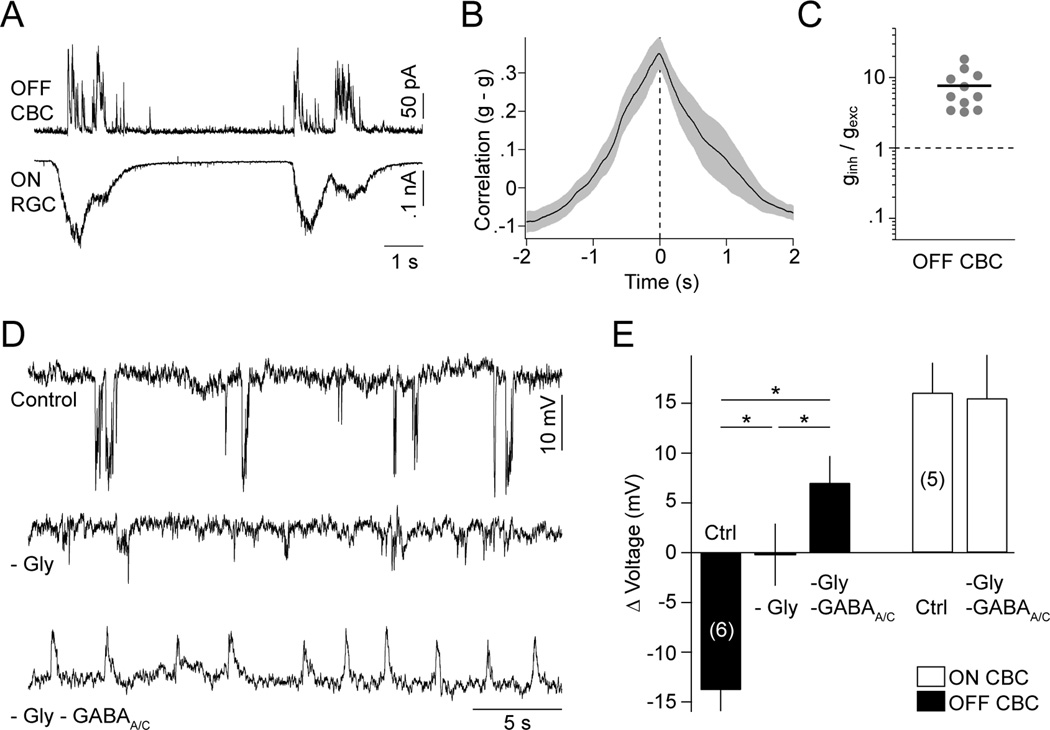
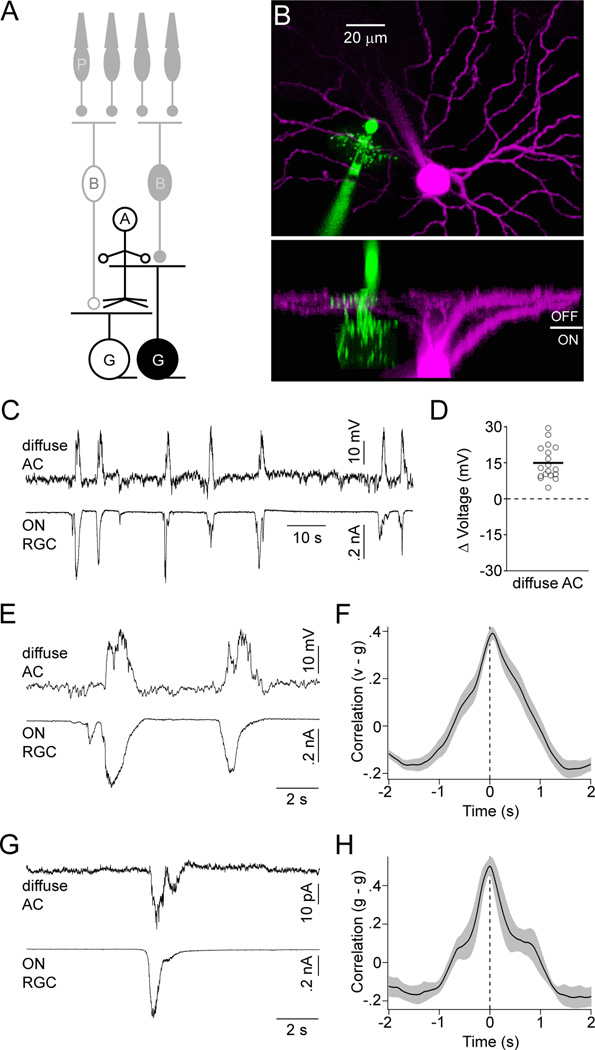
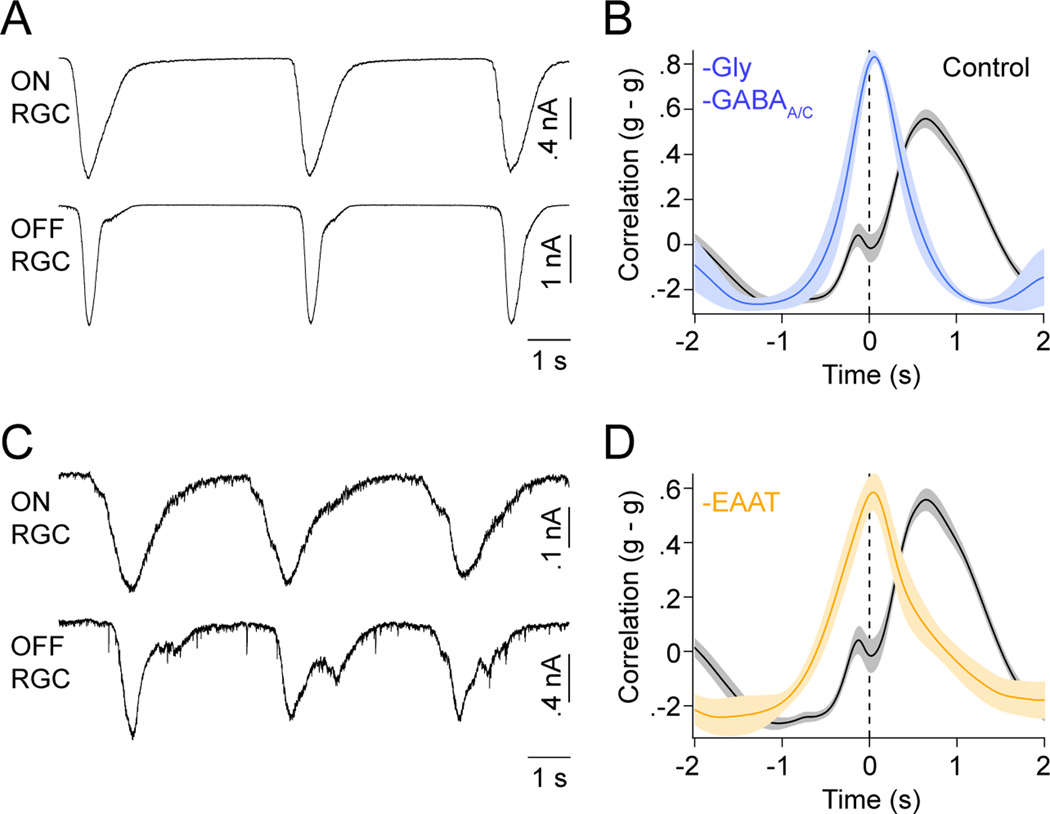
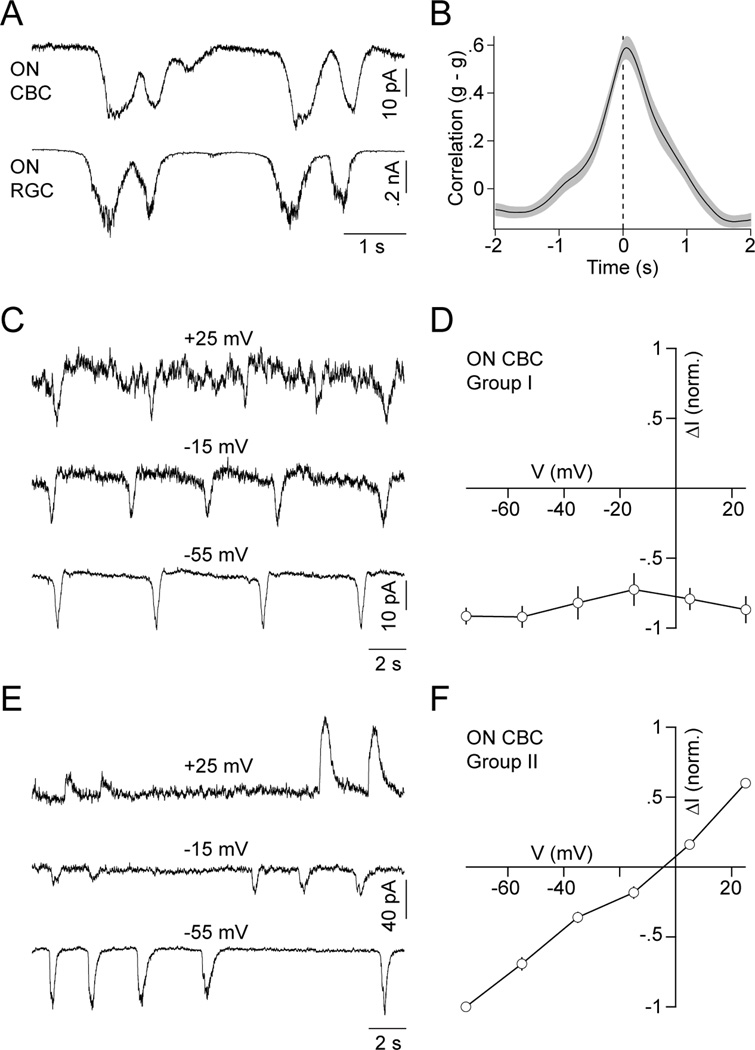
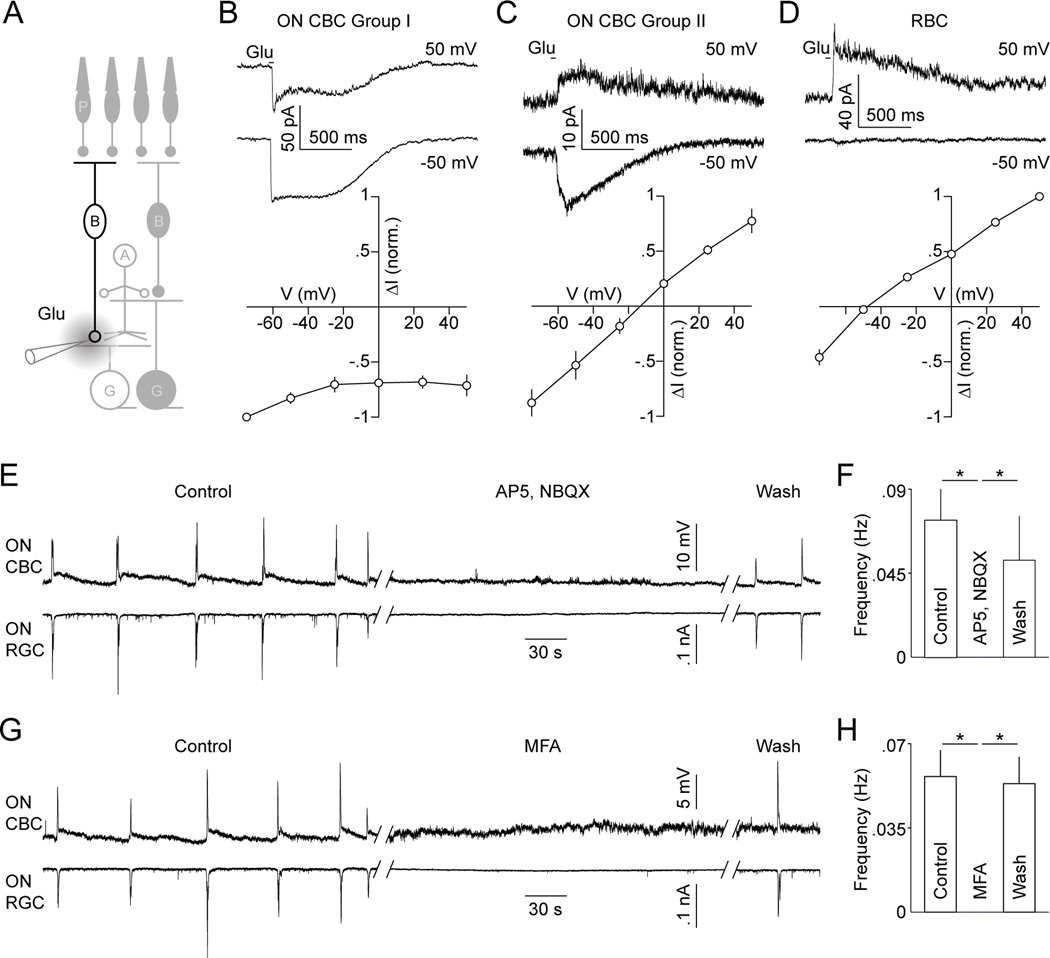
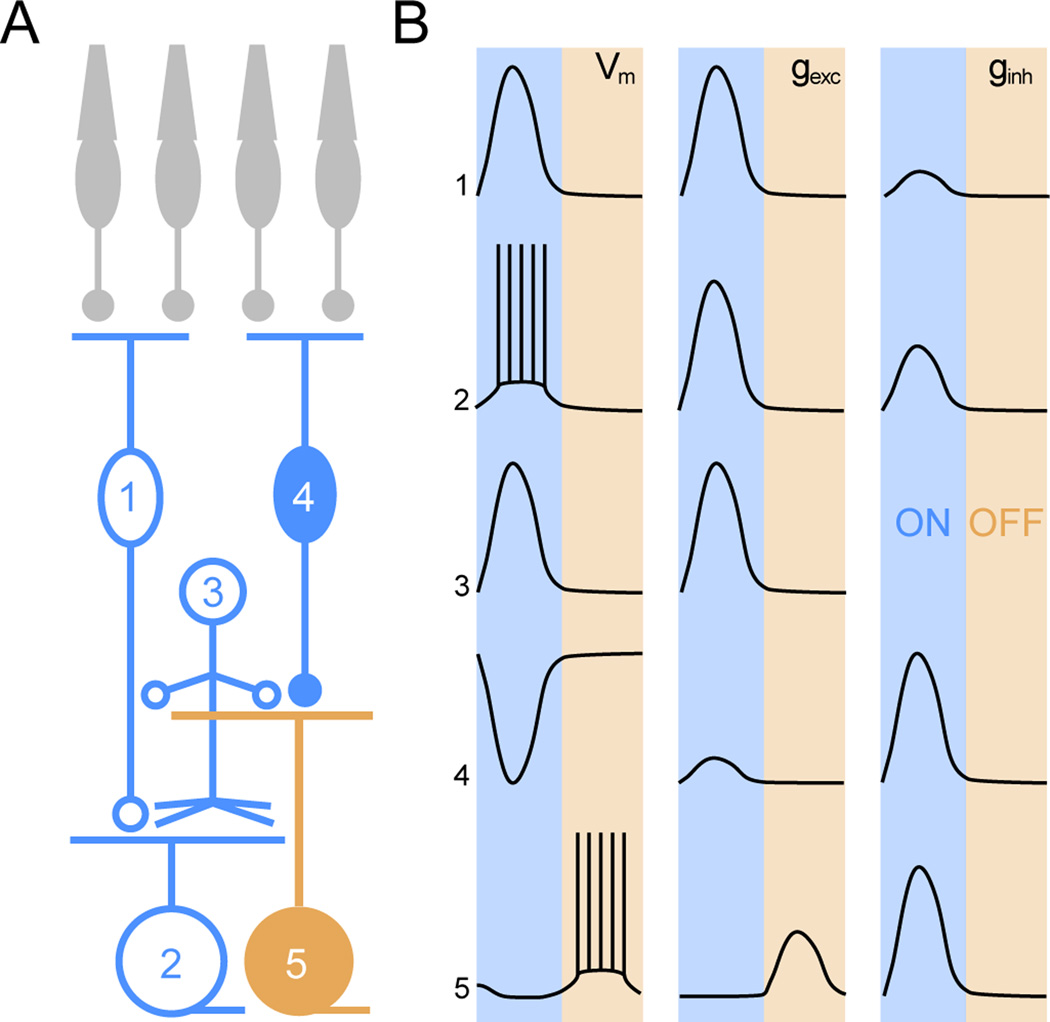
The developing retina generates spontaneous glutamatergic (stage III) waves of activity that sequentially recruit neighboring ganglion cells with opposite light responses (ON and OFF RGCs). This activity pattern is thought to help establish parallel ON and OFF pathways in downstream visual areas. The circuits that produce stage III waves and desynchronize ON and OFF RGC firing remain obscure. Using dual patch-clamp recordings, we find that ON and OFF RGCs receive sequential excitatory input from ON and OFF cone bipolar cells (CBCs), respectively. This input sequence is generated by crossover circuits, in which ON CBCs control glutamate release from OFF CBCs via diffusely stratified inhibitory amacrine cells. In addition, neighboring ON CBCs communicate directly and indirectly through lateral glutamatergic transmission and gap junctions, both of which are required for wave initiation and propagation. Thus, intersecting lateral excitatory and vertical inhibitory circuits give rise to precisely patterned stage III retinal waves.


Figures

Figure 1
Figure 1. Spike and synaptic input patterns of ON and OFF RGCs during stage III waves
(A) Schematic illustration of the retinal circuitry. Letters denote the following cell classes: P -photoreceptors, B - CBCs, A - ACs, G - RGCs. Light responses are indicated by filled (OFF) or open (ON) somata. Cells recorded to obtain the data of this figure are highlighted. (B) Orthogonal projections of a 2-photon image stack of representative ON (green) and OFF (magenta) RGCs recorded in a flat-mounted P12 retina. (C, D) Representative current-clamp (I = 0 pA) traces of neighboring ON and OFF RGCs shown on different timescales. (E) Crosscorrelations of the firing rates (r) of same (black) and opposite (red) sign RGCs during stage III waves. Lines (shaded areas) here and elsewhere represent the means (± SEMs) of the respective populations (n = 4 for same sign and n = 11 for opposite sign RGCs). (F) Representative EPSCs (VM ~ −60 mV) of neighboring ON and OFF RGCs during glutamatergic waves. (G) Crosscorrelations of excitatory conductances (g) of same (n = 10) and opposite sign (n = 10) RGCs. (H) Representative IPSCs (VM ~ 0 mV) of neighboring ON and OFF RGCs. (I) Crosscorrelations of inhibitory conductances (g) of same (n = 7) and opposite (n = 7) sign RGCs color-coded as in (E) and (G). (I) Simultaneously recorded EPSCs and IPSCs from a representative ON and OFF RGCs. (K) Crosscorrelation (n = 8) of excitatory conductances of ON RGCs and inhibitory conductances of OFF RGCs. The ratios of inhibitory (ginh) and excitatory (gexc) conductances of ON (open circles) and OFF (filled circles) RGCs during stage III waves are shown in an inset. Lines indicate the means of the respective populations. See also Figure S1.
Figure 2
Figure 2. ON CBCs depolarize and OFF CBCs hyperpolarize during stage III waves
(A) Schematic of the retinal circuitry with the cells recorded to obtain data presented in this figure highlighted. Labeling as in Figure 1. (B) Representative 2-photon image stack projected along two orthogonal axes. For visual clarity, the recording electrodes have been digitally removed from the side view (bottom panel). (C, D) Simultaneous voltage (I = 0 pA, VRest ~ −63 mV) and EPSC (VM ~ −60 mV) recording of an ON CBC and ON RGC, respectively, during stage III waves, shown on different timescales. (E) Crosscorrelation (mean ± SEM, n = 18) of ON CBC voltage (v) and excitatory synaptic conductance of ON RGCs (or inhibitory conductance of OFF RGC) (g). (F) Simultaneous voltage and EPSC recording of an OFF CBC (VRest ~ −46 mV) and ON RGC. (G) Crosscorrelation (n = 10) of OFF CBC voltage (v) and excitatory conductance of ON RGCs (or inhibitory conductance of OFF RGC) (g). (H) The average of the maximal voltage changes during each wave of a given CBC is indicated by circles (open - ON, filled - OFF). Population averages are shown by lines. (I) The conditional probability of algorithmically detecting a wave in an ON RGC EPSC trace given that a wave was identified in the simultaneously recorded CBC voltage is depicted. Thin lines indicate data from each dual recording. The thick line and filled symbols (errorbars) represent the mean (± SEM) of the population. See also Figure S2.
Figure 3
Figure 3. Glycinergic and GABAergic crossover inhibition hyperpolarizes OFF CBCs during each wave
(A) Simultaneous recording of wave-associated IPSCs (VM ~ 0 mV) in OFF CBCs and EPSCs (VM ~ −60 mV) in ON RGCs. (B) Crosscorrelation (mean ± SEM, n = 7) of inhibitory synaptic conductances of OFF CBCs and excitatory synaptic conductances of ON RGCs. (C) Ratio of inhibitory (ginh) and excitatory (gexc) synaptic conductances activated in OFF CBCs (filled circles) during stage III waves. Line indicates mean of the population. (D) Voltage traces of OFF CBCs in control conditions (top trace), in the presence of strychnine (500 nM, middle trace), and strychnine (500 nM), gabazine (5 µM) and TPMPA (50 µM) (bottom trace). (E) Group data (mean ± SEM) for ON (white bars) and OFF (black bars) CBCs illustrating the cell-type-specific effects of inhibitory blockers on stage III voltage responses. See also Figures S3 and S4.
Figure 4
Figure 4. Diffuse ACs receive excitatory input and depolarize during the ON phase of stage III waves
(A) Circuit diagram of the retina in which neurons recorded for this figure are highlighted; labeling as in Figure 1. (B) Orthogonal projections of a 2-photon image stack of a diffuse AC (green) and OFF RGC (magenta) filled during a recording. (C) Simultaneous current- (I = 0 pA, VRest ~ −46 mV) and voltage-clamp clamp (EPSCs, VM ~ −60 mV) recording from a diffuse AC and ON RGC, respectively. (D) The mean maximal voltage change during waves for each diffuse AC is indicated by open circles. A solid line shows the mean of all diffuse ACs (n = 18) analyzed. (E) Excerpts of the traces in (C) on an expanded timescale. (F) Crosscorrelation (mean ± SEM, n = 9) of the membrane potential (v) of diffuse ACs with excitatory conductances in ON RGCs (or inhibitory conductances in OFF RGCs) (g). (G) Simultaneous recording of EPSCs in a diffuse AC and an ON RGC. (H) Crosscorrelation (mean ± SEM, n = 5) of excitatory conductances in diffuse ACs (g) with excitatory conductances in ON RGCs (or inhibitory conductances in OFF RGCs) (g).
Figure 5
Figure 5. Blockade of crossover inhibition and glutamate uptake synchronize EPSCs of ON and OFF RGCs
(A) Representative simultaneous recording of EPSCs from ON and OFF RGCs in the presence of strychnine (500 nM), gabazine (5 µM) and TPMPA (50 µM). (B) Crosscorrelation (mean ± SEM, Control n = 15, -Gly -GABAA/Cn = 4) of excitatory synaptic conductances (g) of ON and OFF RGCs in control conditions (black) or in the presence of glycinergic- and GABAergic blockers (blue). (C) Representative EPSC traces from simultaneously recorded ON and OFF RGCs in the presence of the glutamate uptake inhibitor TBOA (25 µM). (D) Crosscorrelation (mean ± SEM, Control n = 15, -TBOA n = 5) of excitatory synaptic conductances in ON and OFF RGCs. As in (B) control results obtained in control conditions are depicted in black. Crosscorrelations recorded in the presence of TBOA are shown in orange. See also Figures S5 and S6.
Figure 6
Figure 6. ON CBCs receive excitatory input during waves via cation-nonselctive conductances and gap junctions
(A) Simultaneous recording of EPSCs of an ON CBC and ON RGC during stage III waves. (B) Crosscorrelation (mean ± SEM, n = 8) of excitatory synaptic conductances (g) of ON CBCs and ON RGCs. (C, E) Voltage-clamp traces of a representative group I (C) and II (E) ON CBC in the presence of strychnine (500 nM), gabazine (5 µM) and TPMPA (50 µM) at a series of holding potentials. (D, F) Normalized I-V relationship (mean ± SEM) of wave-associated input currents to group I (D, n = 3) and II (F, n = 3) ON CBCs during blockade of inhibitory synaptic transmission.
Figure 7
Figure 7. Focal application of glutamate activates distinct currents in ON CBCs and antagonists of iGluRs and gap junctions blocks stage III waves in ON CBCs and RGCs
(A) Schematic illustrating focal application of glutamate in the I PL. (B - D) Representative traces (top panels) and summary data (bottom panels) of currents elicited by glutamate in different BC types: Group I ON CBCs (B, n = 7), group II ON CBCs (C, n = 4) and RBCs (D, n = 5). (E, G) Dual current- (I = 0 pA, VRest ~ −65 mV) and voltage-clamp (EPSCs, VM ~ −60 mV) recordings from ON CBCs and ON RGCs, respectively. Traces are shown in control solution, during application of 90 µM AP5 and 20 µM NBQX (E) or 200 µM MFA (G), and after washout of these drugs. (F, H) Average (± SEM) rate of waves in these conditions (AP5, NBQX n = 5; MFA n = 6). See also Figures S7.
Figure 8
Figure 8. Schematic illustration of retinal circuit activation during stage III waves
(A) Circuit diagram of the retina. Numbers denote: 1 - ON CBC, 2 - ON RGC, 3 - diffuse AC, 4 -OFF CBC, 5 - OFF RGC. Color cording indicates whether the respective neurons participate in the ON (blue) or OFF (orange) phase of stage III waves. (B) Activity patterns (VM) as well as excitatory (gexc) and inhibitory (ginh) synaptic conductances of the cells depicted in (A) are summarized. Shaded areas mark the ON and OFF phase of stage III waves. The relative amplitudes of gexc and ginh traces are representative of the relative size of these conductances in a given cell but not between different cells.

References

    1. Ackman JB, Burbridge TJ, Crair MC. Retinal waves coordinate patterned activity throughout the developing visual system. Nature. 2012;490:219–225. - PMC - PubMed
    1. Arai I, Tanaka M, Tachibana M. Active roles of electrically coupled bipolar cell network in the adult retina. J Neurosci. 2010;30:9260–9270. - PMC - PubMed
    1. Blankenship AG, Feller MB. Mechanisms underlying spontaneous patterned activity in developing neural circuits. Nat Rev Neurosci. 2010;11:18–29. - PMC - PubMed
    1. Blankenship AG, Ford KJ, Johnson J, Seal RP, Edwards RH, Copenhagen DR, Feller MB. Synaptic and extrasynaptic factors governing glutamatergic retinal waves. Neuron. 2009;62:230–241. - PMC - PubMed
    1. Blankenship AG, Hamby AM, Firl A, Vyas S, Maxeiner S, Willecke K, Feller MB. The role of neuronal connexins 36 and 45 in shaping spontaneous firing patterns in the developing retina. J Neurosci. 2011;31:9998–10008. - PMC - PubMed

Publication types

LinkOut - more resources