

Hypothesis driven single nucleotide polymorphism search (HyDn-SNP-S)
- PMID: 23830898
- PMCID: PMC3916134
- DOI: 10.1016/j.dnarep.2013.06.001
Hypothesis driven single nucleotide polymorphism search (HyDn-SNP-S)
Erratum in
- DNA Repair (Amst). 2014 Mar;15:60
Abstract
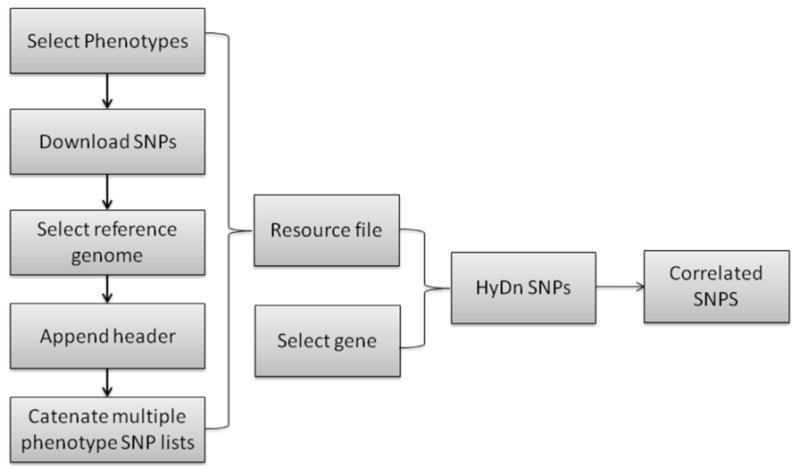
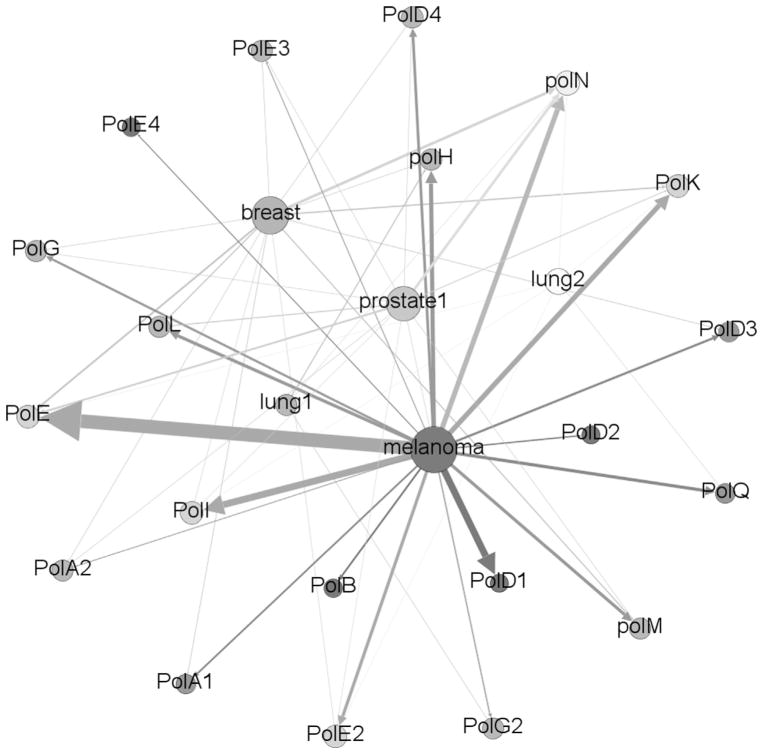
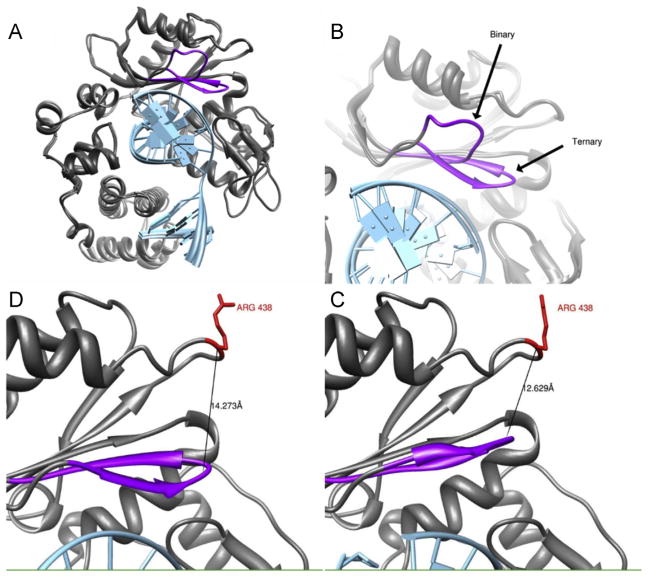
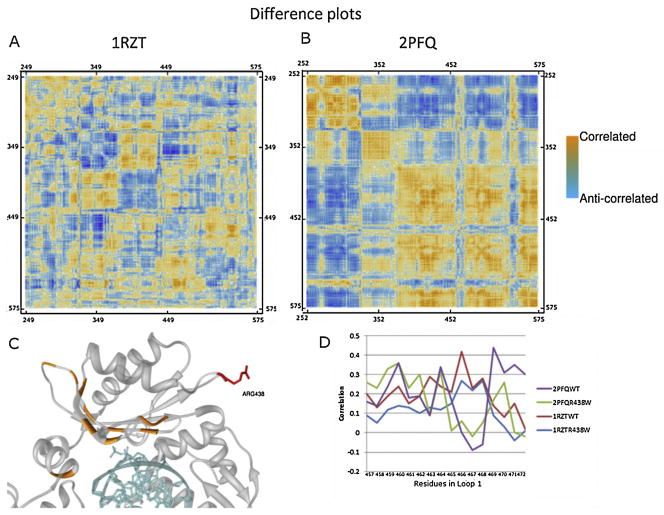
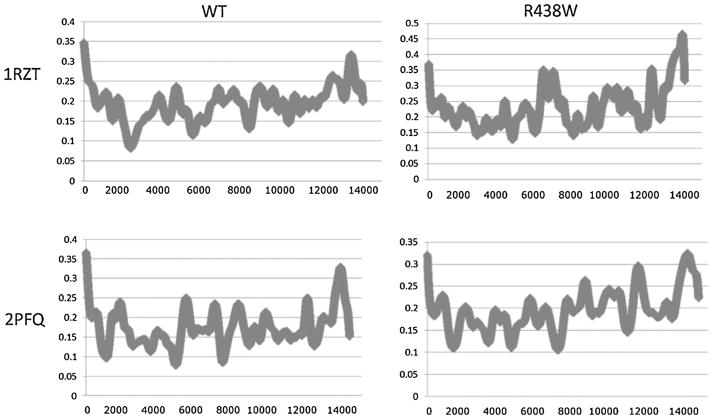
The advent of complete-genome genotyping across phenotype cohorts has provided a rich source of information for bioinformaticians. However the search for SNPs from this data is generally performed on a study-by-study case without any specific hypothesis of the location for SNPs that are predictive for the phenotype. We have designed a method whereby very large SNP lists (several gigabytes in size), combining several genotyping studies at once, can be sorted and traced back to their ultimate consequence in protein structure. Given a working hypothesis, researchers are able to easily search whole genome genotyping data for SNPs that link genetic locations to phenotypes. This allows a targeted search for correlations between phenotypes and potentially relevant systems, rather than utilizing statistical methods only. HyDn-SNP-S returns results that are less data dense, allowing more thorough analysis, including haplotype analysis. We have applied our method to correlate DNA polymerases to cancer phenotypes using four of the available cancer databases in dbGaP. Logistic regression and derived haplotype analysis indicates that ~80SNPs, previously overlooked, are statistically significant. Derived haplotypes from this work link POLL to breast cancer and POLG to prostate cancer with an increase in incidence of 3.01- and 9.6-fold, respectively. Molecular dynamics simulations on wild-type and one of the SNP mutants from the haplotype of POLL provide insights at the atomic level on the functional impact of this cancer related SNP. Furthermore, HyDn-SNP-S has been designed to allow application to any system. The program is available upon request from the authors.
Keywords: Biomarkers; Cancer; DNA polymerases; Molecular dynamics; SNP search.
Copyright © 2013 Elsevier B.V. All rights reserved.
Conflict of interest statement
The authors declare that there are no conflicts of interest.
Figures
Similar articles
-
Integration of HapMap-based SNP pattern analysis and gene expression profiling reveals common SNP profiles for cancer therapy outcome predictor genes.Cell Cycle. 2006 Nov;5(22):2613-25. doi: 10.4161/cc.5.22.3498. Epub 2006 Nov 15. Cell Cycle. 2006. PMID: 17172834
-
Multi-SNP Haplotype Analysis Methods for Association Analysis.Methods Mol Biol. 2017;1666:485-504. doi: 10.1007/978-1-4939-7274-6_24. Methods Mol Biol. 2017. PMID: 28980261
-
The impact of missing and erroneous genotypes on tagging SNP selection and power of subsequent association tests.Hum Hered. 2006;61(1):31-44. doi: 10.1159/000092141. Epub 2006 Mar 23. Hum Hered. 2006. PMID: 16557026
-
[Analysis and application of SNP and haplotype in the human genome].Yi Chuan Xue Bao. 2005 Aug;32(8):879-89. Yi Chuan Xue Bao. 2005. PMID: 16231744 Review. Chinese.
-
[Advances in high-density whole genome-wide single nucleotide polymorphism array in cancer research].Ai Zheng. 2006 Nov;25(11):1454-8. Ai Zheng. 2006. PMID: 17094921 Review. Chinese.
Cited by
-
Biophysical and Mechanistic Models for Disease-Causing Protein Variants.Trends Biochem Sci. 2019 Jul;44(7):575-588. doi: 10.1016/j.tibs.2019.01.003. Epub 2019 Jan 31. Trends Biochem Sci. 2019. PMID: 30712981 Free PMC article. Review.
-
Towards a comprehensive view of 8-oxo-7,8-dihydro-2'-deoxyguanosine: Highlighting the intertwined roles of DNA damage and epigenetics in genomic instability.DNA Repair (Amst). 2021 Jan;97:103027. doi: 10.1016/j.dnarep.2020.103027. Epub 2020 Nov 26. DNA Repair (Amst). 2021. PMID: 33285475 Free PMC article. Review.
-
Estrogen Drives Cellular Transformation and Mutagenesis in Cells Expressing the Breast Cancer-Associated R438W DNA Polymerase Lambda Protein.Mol Cancer Res. 2016 Nov;14(11):1068-1077. doi: 10.1158/1541-7786.MCR-16-0209. Epub 2016 Sep 12. Mol Cancer Res. 2016. PMID: 27621267 Free PMC article.
-
Computational compensatory mutation discovery approach: Predicting a PARP1 variant rescue mutation.Biophys J. 2022 Oct 4;121(19):3663-3673. doi: 10.1016/j.bpj.2022.05.036. Epub 2022 May 30. Biophys J. 2022. PMID: 35642254 Free PMC article.
-
Characterization of Nine Cancer-Associated Variants in Human DNA Polymerase κ.Chem Res Toxicol. 2018 Aug 20;31(8):697-711. doi: 10.1021/acs.chemrestox.8b00055. Epub 2018 Jul 30. Chem Res Toxicol. 2018. PMID: 30004685 Free PMC article.
References
-
- The Human Genome Project: 10 years later. Lancet. 2010;375:2194. - PubMed
-
- Caskey CT. Presymptomatic diagnosis: a first step toward genetic health care. Science. 1993;262:48–49. - PubMed
-
- Caskey CT. Using genetic diagnosis to determine individual therapeutic utility. Annu Rev Med. 2010;61:1–15. - PubMed
-
- Peakall D, Shugart L. The Human Genome Project (HGP) Ecotoxicology. 2002;11:7. - PubMed
-
- Rossiter BJ, Caskey CT. Presymptomatic testing for genetic diseases of later life: pharmacoepidemiological considerations. Drugs Aging. 1995;7:117–130. - PubMed
Publication types
MeSH terms
Substances
Grants and funding
LinkOut - more resources
Full Text Sources
Other Literature Sources
