. 2014 Jan:35:33-42.
doi: 10.1016/j.bbi.2013.06.007. Epub 2013 Jul 4.

Obesity induced by a high-fat diet is associated with increased immune cell entry into the central nervous system

Affiliations

Obesity induced by a high-fat diet is associated with increased immune cell entry into the central nervous system

Laura B Buckman et al. Brain Behav Immun. 2014 Jan.

Abstract

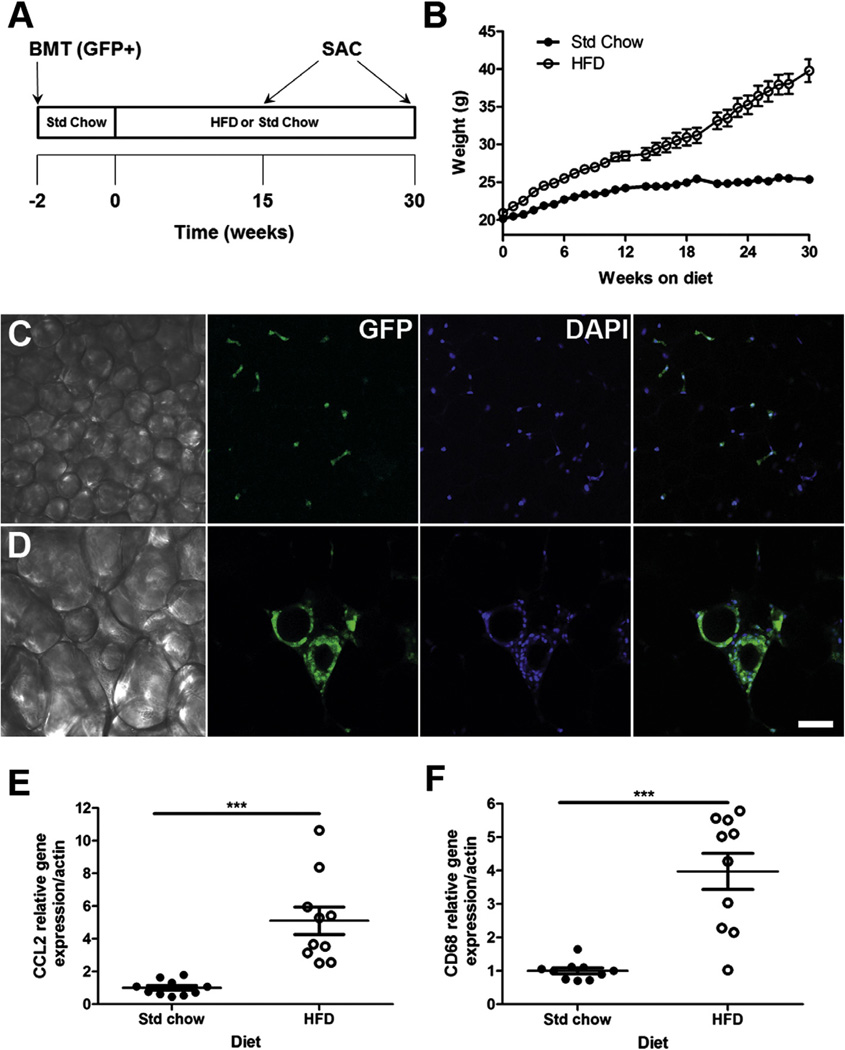
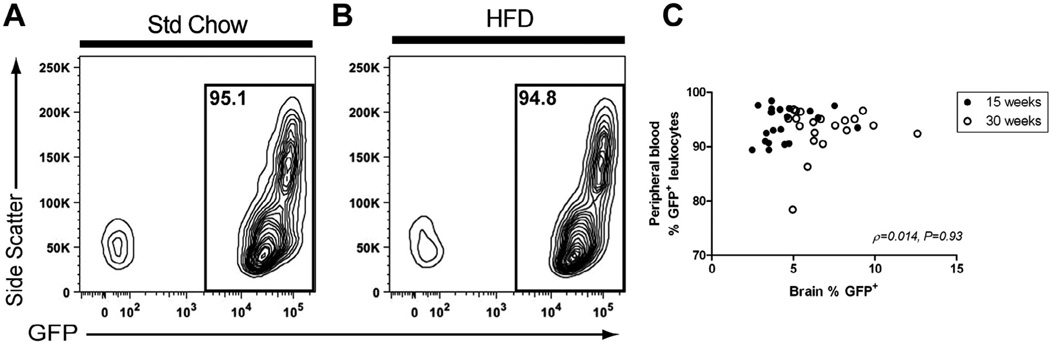
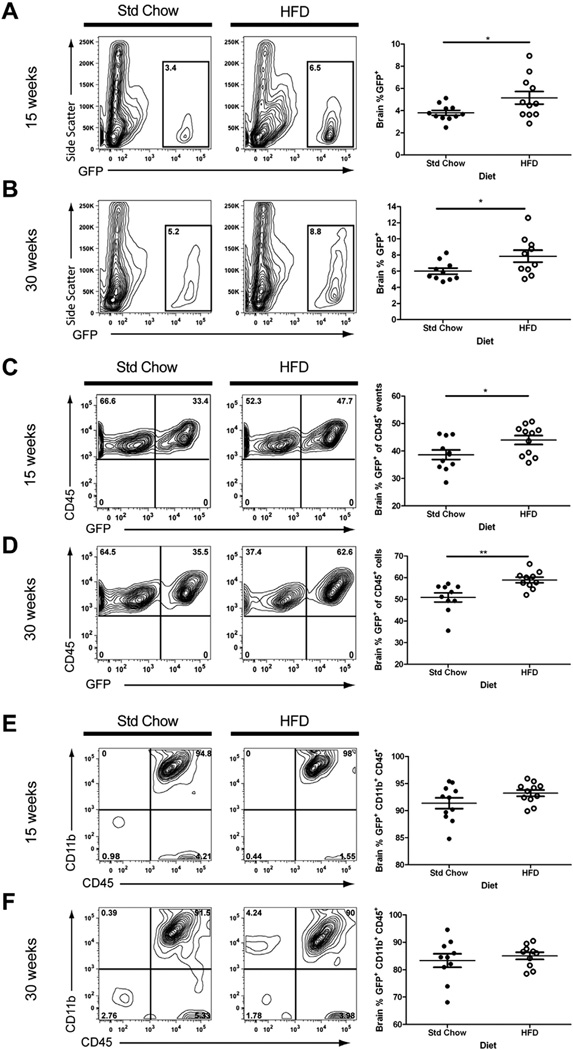
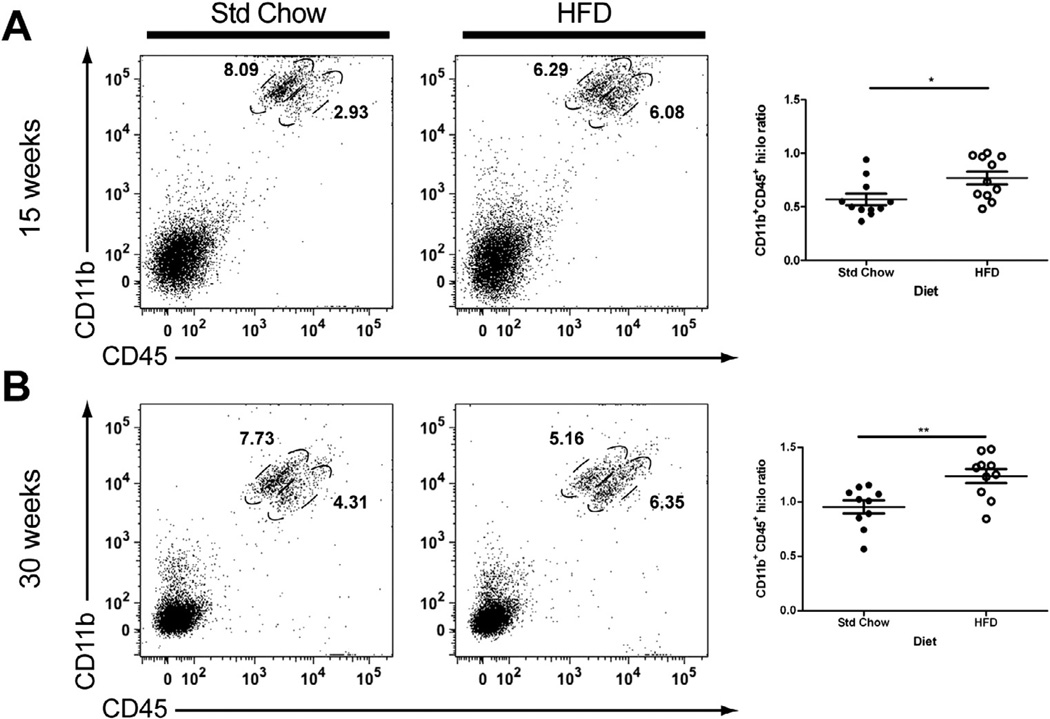
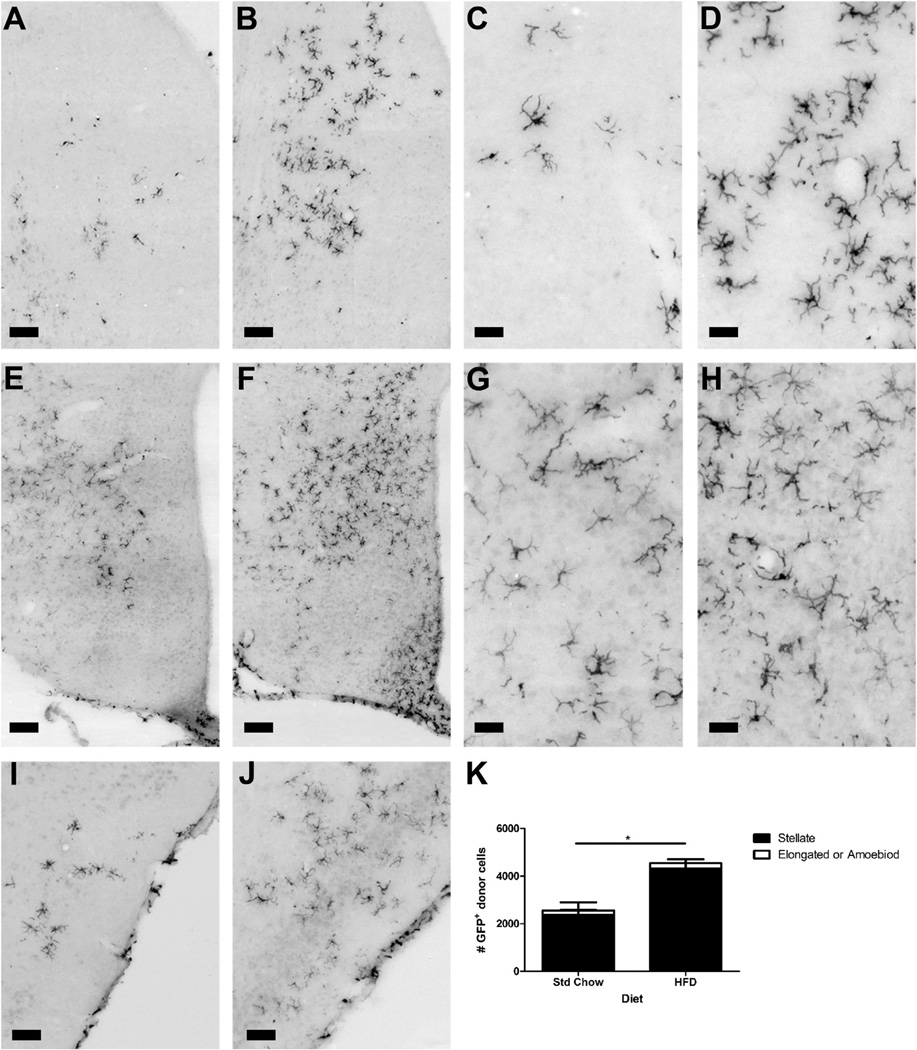
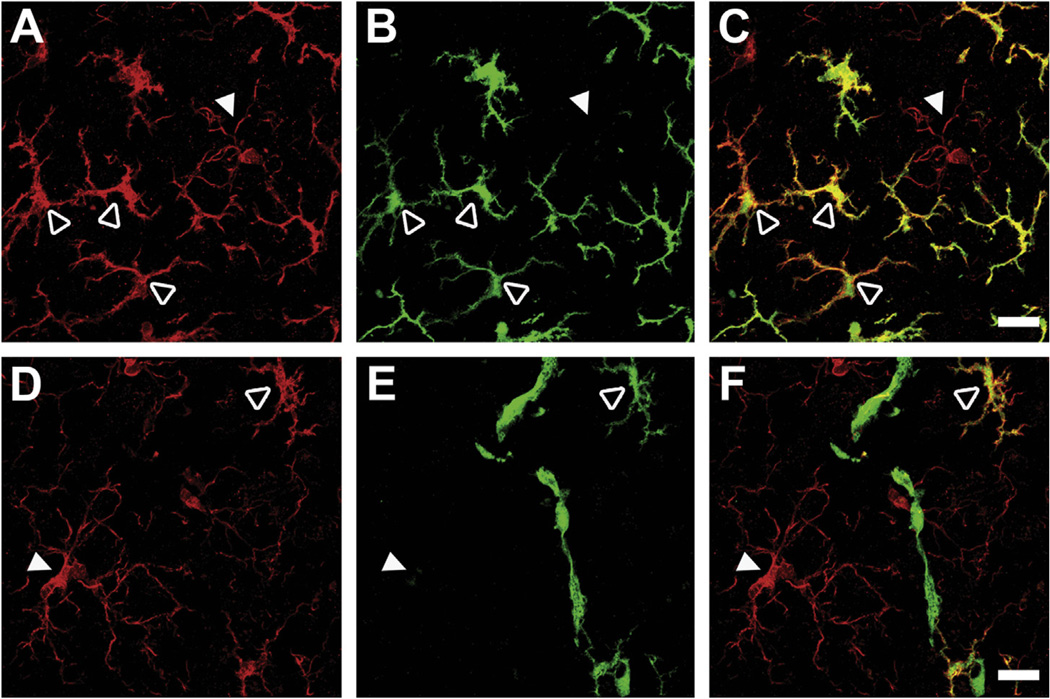
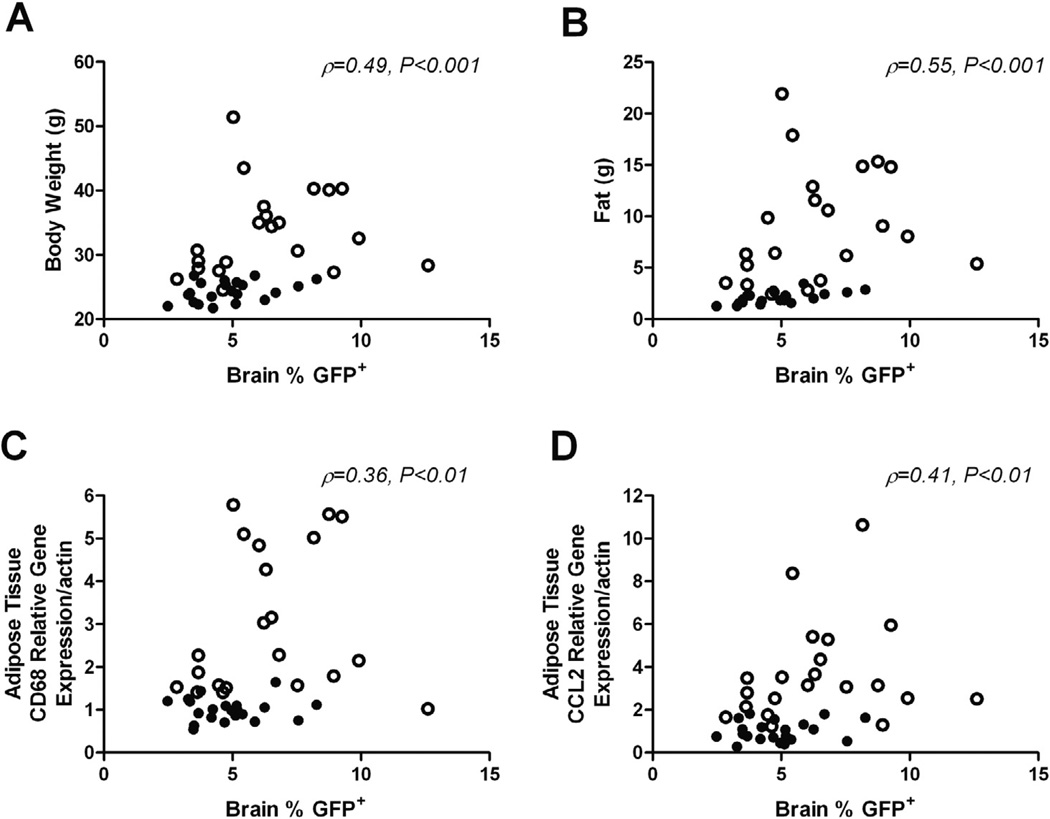
Obesity is associated with chronic low-grade inflammation in peripheral tissues caused, in part, by the recruitment of inflammatory monocytes into adipose tissue. Studies in rodent models have also shown increased inflammation in the central nervous system (CNS) during obesity. The goal of this study was to determine whether obesity is associated with recruitment of peripheral immune cells into the CNS. To do this we used a bone marrow chimerism model to track the entry of green-fluorescent protein (GFP) labeled peripheral immune cells into the CNS. Flow cytometry was used to quantify the number of GFP(+) immune cells recruited into the CNS of mice fed a high-fat diet compared to standard chow fed controls. High-fat feeding resulted in obesity associated with a 30% increase in the number of GFP(+) cells in the CNS compared to control mice. Greater than 80% of the GFP(+) cells recruited to the CNS were also CD45(+) CD11b(+) indicating that the GFP(+) cells displayed characteristics of microglia/macrophages. Immunohistochemistry further confirmed the increase in GFP(+) cells in the CNS of the high-fat fed group and also indicated that 93% of the recruited cells were found in the parenchyma and had a stellate morphology. These findings indicate that peripheral immune cells can be recruited to the CNS in obesity and may contribute to the inflammatory response.

Keywords: Bone marrow chimera; High-fat diet; Inflammation; Microglia; Neuroinflammation; Obesity.


Figures

Fig. 1
Fig. 1
Bone marrow chimeras show obesity and adipose tissue inflammation in response to a high-fat diet. C57BL/6J mice transplanted with GFP+ (donor) bone marrow were randomly divided into two groups and fed either a 60% high-fat (HFD) or standard chow (Std Chow) diet for 15 or 30 weeks (A). Body weight was increased by high-fat diet (B). Confocal imaging demonstrated adipocyte hypertrophy (C, Std chow; D, HFD) and recruitment of GFP+ (green) cells into white adipose. DAPI nuclear stain indicated in blue. White adipose tissue gene expression of inflammatory markers CCL2 (E) and CD68 (F) was significantly higher in mice fed a HF diet after 30 weeks. For real-time RT-PCR data, data are presented as mean ± S.E.M., n = 10 mice per diet. An unpaired Student’s t-test was performed for statistical evaluation of the data. ***P < 0.001. Scale bar = 50 µm. (For interpretation of the references to colour in this figure legend, the reader is referred to the web version of this article.)
Fig. 2
Fig. 2
The mean percentage of GFP+ peripheral blood leukocytes was greater than 90% across all animals. Donor-derived GFP+ cells in the blood of recipient animals were assessed by flow cytometry and ranged from 78% to 98% of total peripheral blood leukocytes. Representative contour plots are shown gated for GFP+ cells (A and B). No correlation was observed between the percentage of GFP+ cells in the brains and peripheral blood of BM chimeras (C). Spearman correlation was performed for statistical evaluation of the data. ρ and P values for association indicated on graph (n = 10–11/diet/timepoint).
Fig. 3
Fig. 3
Obesity is associated with increased immune cell entry into the CNS. Brain cells were isolated from recipient mice after 15 or 30 weeks on a HFD or Std Chow diet and analyzed by flow cytometry. High-fat feeding led to increased CNS infiltration of GFP+ immune cells at both the 15 and 30 week time points, shown as a percentage of single cell events (A and B) or as a percentage of cells that were positive for the hematopoietic lineage marker CD45 (C and D). Greater than 80% of the GFP+ cells expressed microglial markers CD11b and CD45 (E and F, upper right quadrants). Representative contour plots are shown for each diet/time point. Data are presented as mean ± S.E.M. (n = 10–11). An unpaired Student’s t-test was performed for statistical evaluation of the data. *P < 0.05, **P < 0.001.
Fig. 4
Fig. 4
Obesity is associated with increased CD45hi-expressing microglia/macrophages in the CNS. Flow cytometric analysis revealed that the percentage of CD11b+ cells that expressed high levels of CD45 was increased in HFD-induced obese mice at 15 (A) and 30 (B) week time points as compared to lean Std Chow-fed controls. Representative dot plots are shown gated for CD45hi and CD45lo cells. Data are presented as mean ± S.E.M. (n = 10–11). An unpaired Student’s t-test was performed for statistical evaluation of the data. *P < 0.05; **P < 0.01.
Fig. 5
Fig. 5
Distribution of GFP+ immune cells in the CNS. Immunohistochemistry for GFP+ cells showed increased recruitment in HFD animals compared with Std Chow controls. Representative images are shown for the septum (Std Chow – A and C; HFD – B and D); hypothalamus (Std Chow – E and G; HFD – F and H) and cortex (Std Chow – I; HFD – J). There was a statistically significant increase in total GFP+ cells in the HFD animals due to an increase in cells of stellate morphology in the parenchyma. Data are presented as mean ± S.E.M. (n = 3). Two-way ANOVA was performed for statistical evaluation of the data. *P < 0.05 scale bars: Panels A, B, I and J = 100 µm; Panels C, D, G and H = 50 µm; Panels E and F = 75 µm.
Fig. 6
Fig. 6
Morphology of GFP+ cells recruited to the CNS. Confocal microscopy of CNS sections from recipient mice confirmed that GFP+ cells expressed microglial marker Iba1 and had a stellate appearance (A–F, open arrowheads) compared with resident microglia which displayed a ramified (“resting”) phenotype (A–F, closed arrowheads). Representative images showing microglia in red (Iba1; A and D), GFP in green (B and E), and overlay in yellow-orange (C and F). Co-localization of GFP and Iba1 staining was used to distinguish recruited cells (Iba1+GFP+) from resident microglia (Iba1+GFP) (upper panels). The few GFP+ cells that were negative for Iba1 were associated with blood vessels with an elongated morphology similar to perivascular macrophages (lower panels). Scale bars = 20 µm. (For interpretation of the references to colour in this figure legend, the reader is referred to the web version of this article.)
Fig. 7
Fig. 7
Infiltration of GFP+ peripheral immune cells into the CNS is positively correlated with measures of adiposity and white adipose tissue inflammation. The relationship between the percentage of GFP+ cells in the brains of chimeric mice with body weight (A), fat mass (B) and adipose tissue CD68 (C) and CCL2 (D) mRNA expression, across all groups. Data were analyzed using Spearman correlation. ρ and P values for associations indicated on graphs (n = 10–11/diet/timepoint). ○, HF; ●, Std Chow.

References

    1. Ajami B, Bennett JL, Krieger C, Tetzlaff W, Rossi FM. Local self-renewal can sustain CNS microglia maintenance and function throughout adult life. Nat. Neurosci. 2007;10(12):1538–1543. - PubMed
    1. Akiyama H, Ikeda K, Katoh M, McGeer EG, McGeer PL. Expression of MRP14, 27E10, interferon-alpha and leukocyte common antigen by reactive microglia in postmortem human brain tissue. J. Neuroimmunol. 1994;50(2):195–201. - PubMed
    1. Buckman LB, Thompson MM, Moreno HN, Ellacott KL. Regional astrogliosis in the mouse hypothalamus in response to obesity. J. Comp. Neurol. 2013;521(6):1322–1333. - PMC - PubMed
    1. Ogden CL, Carroll MD, Kit BK, Flegal KM. Prevalence of obesity in the United States, 2009–2010. NCHS data brief, No 82. Hyattsville, MD: National Center for Health Statistics; 2012. - PubMed
    1. Chan WY, Kohsaka S, Rezaie P. The origin and cell lineage of microglia: new concepts. Brain Res. Rev. 2007;53(2):344–354. - PubMed

Publication types