

Graph theory analysis of cortical-subcortical networks in late-life depression
- PMID: 23831171
- PMCID: PMC3858393
- DOI: 10.1016/j.jagp.2013.03.005
Graph theory analysis of cortical-subcortical networks in late-life depression
Abstract
Objectives: Late-life major depression (LLD) is characterized by distinct epidemiologic and psychosocial factors, as well as medical comorbidities that are associated with specific neuroanatomical differences. The purpose of this study was to use interregional correlations of cortical and subcortical volumes to examine cortical-subcortical structural network properties in subjects with LLD compared with healthy comparison subjects.
Methods: This was a cross-sectional neuroimaging study conducted in the general community. We recruited 73 healthy elderly comparison subjects and 53 subjects with LLD who volunteered in response to advertisements. Brain network connectivity measures were generated by correlating regional volumes after controlling for age, gender, and intracranial volume by using the Brain Connectivity Toolbox.
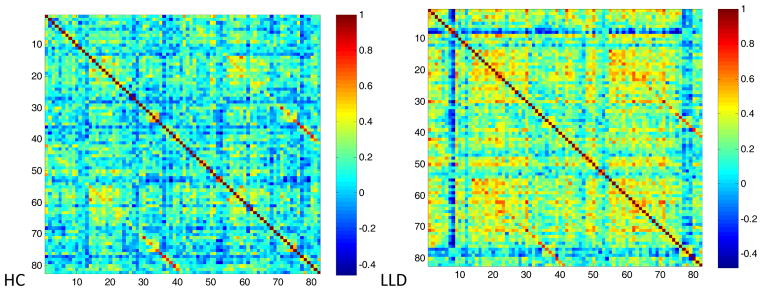
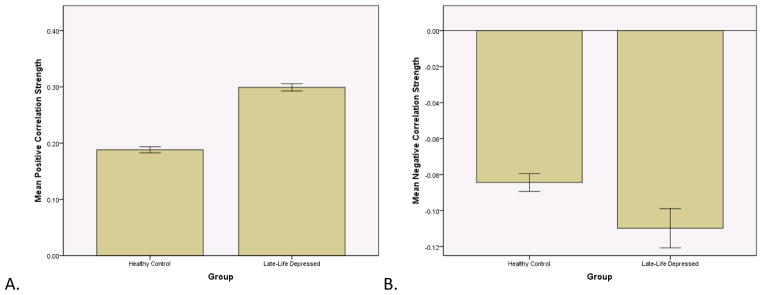
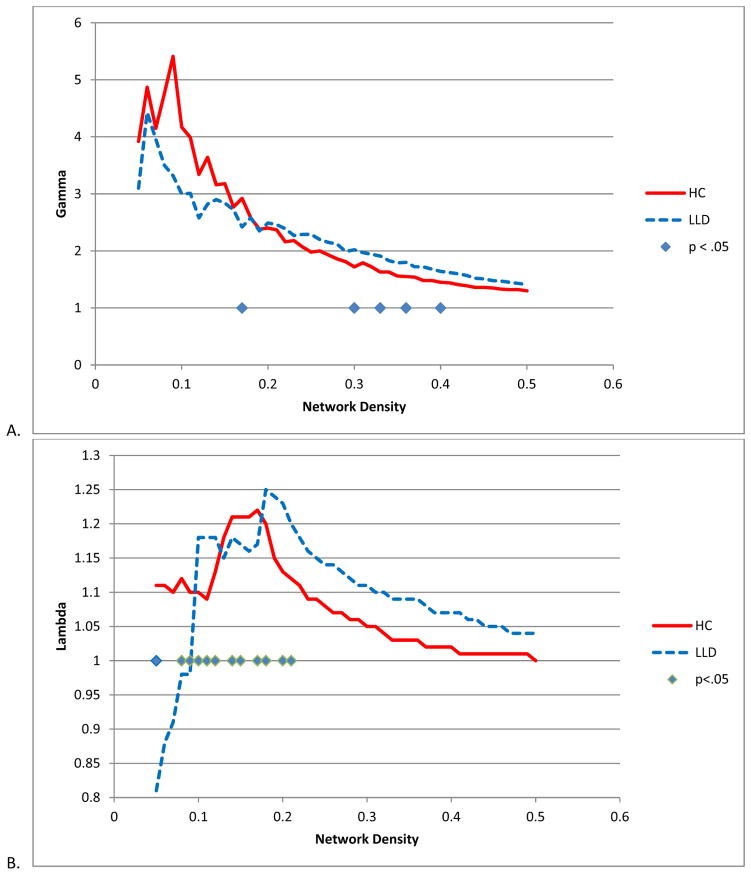
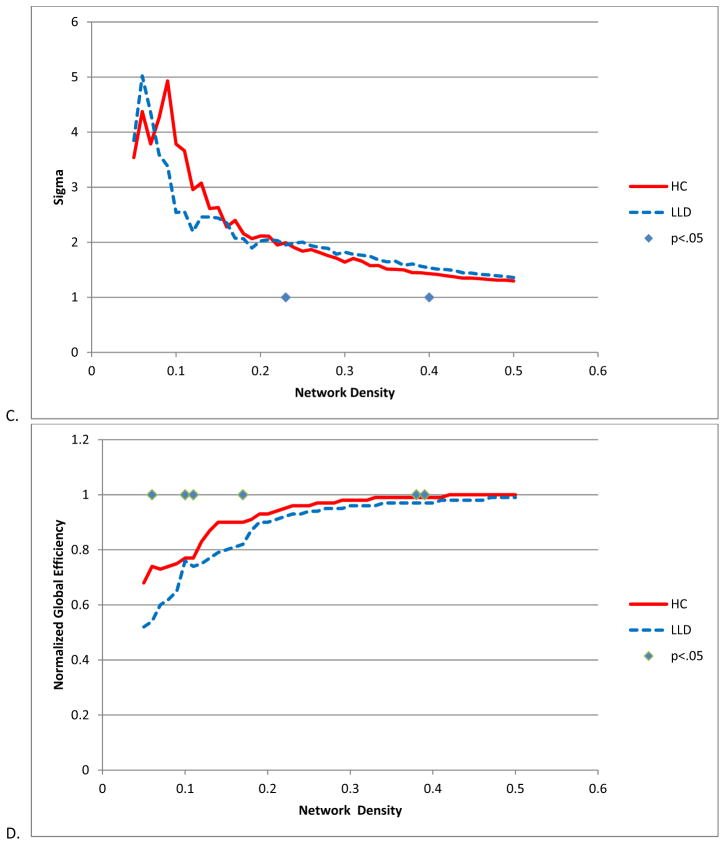
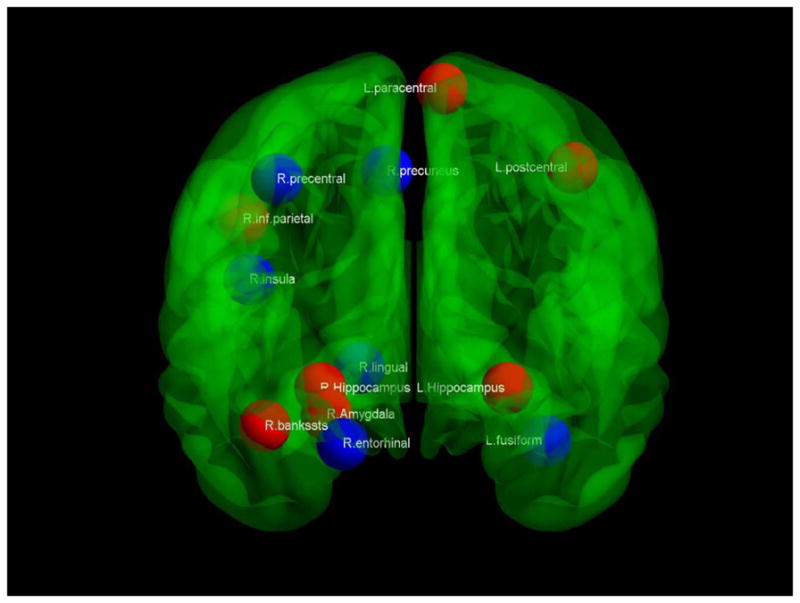
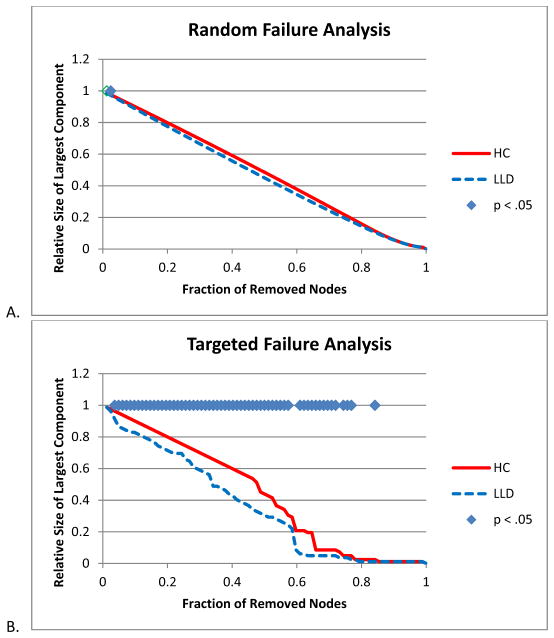
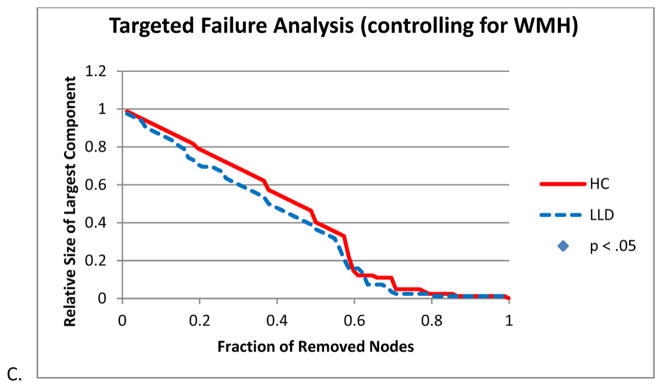
Results: Results for overall network strength revealed that LLD networks showed a greater magnitude of associations for both positive and negative correlation weights compared with healthy elderly networks. LLD networks also demonstrated alterations in brain network structure compared with healthy comparison subjects. LLD networks were also more vulnerable to targeted attacks compared with healthy elderly comparison subjects, and this vulnerability was attenuated when controlling for white matter alterations.
Conclusions: Overall, this study demonstrates that cortical-subcortical network properties are altered in LLD and may reflect the underlying neuroanatomical vulnerabilities of the disorder.
Keywords: Connectivity; depression; geriatric; network analysis; neuroimaging.
Copyright © 2014 American Association for Geriatric Psychiatry. Published by Elsevier Inc. All rights reserved.
Figures
References
-
- Alexopoulos GS. Depression in the elderly. Lancet. 2005;365 (9475):1961–1970. - PubMed
-
- Alexopoulos GS, Kiosses DN, Choi SJ, et al. Frontal white matter microstructure and treatment response of late-life depression: a preliminary study. Am J Psychiatry. 2002;159 (11):1929–1932. - PubMed
-
- Beck AT, Steer RA, Brown GK. Manual for the Beck Depression Inventory-II. San Antonio, TX: The Psychological Corporation; 1996.
Publication types
MeSH terms
Grants and funding
LinkOut - more resources
Full Text Sources
Other Literature Sources
