. 2013 Aug;19(8):1067-72.
doi: 10.1038/nm.3252. Epub 2013 Jul 7.

In vivo imaging of glucose uptake and metabolism in tumors

Affiliations

In vivo imaging of glucose uptake and metabolism in tumors

Simon Walker-Samuel et al. Nat Med. 2013 Aug.

Abstract

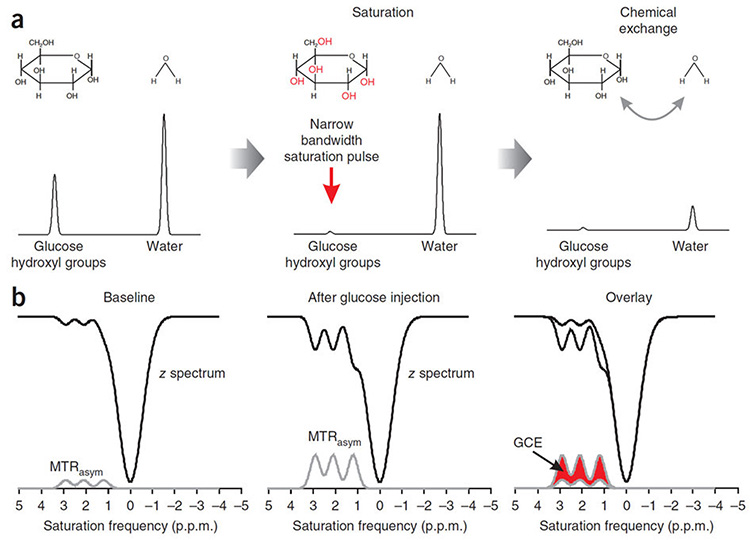
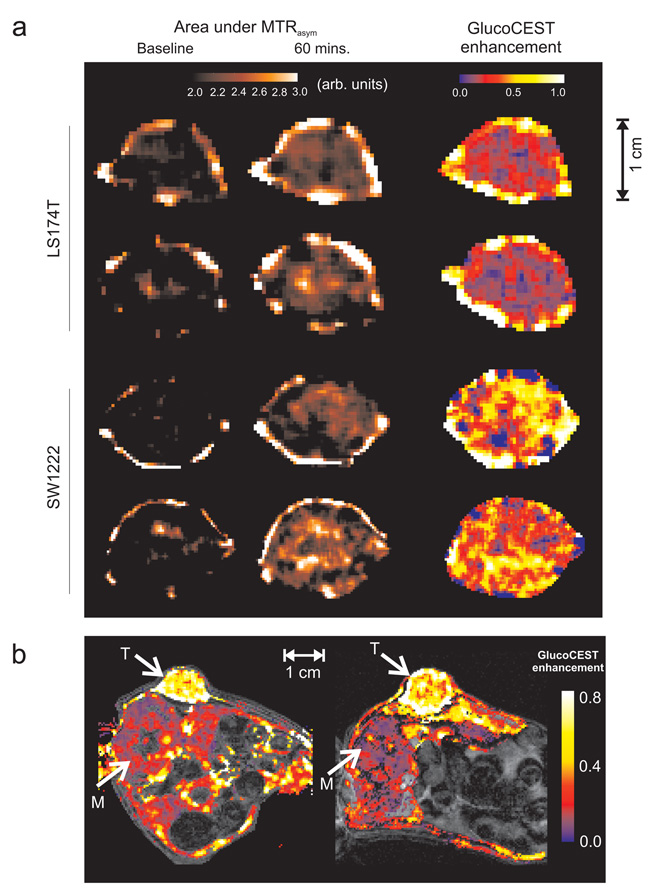
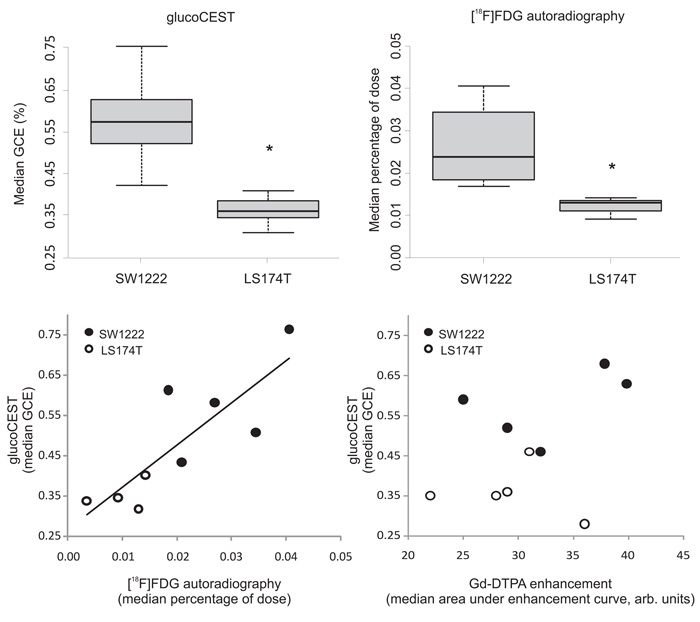
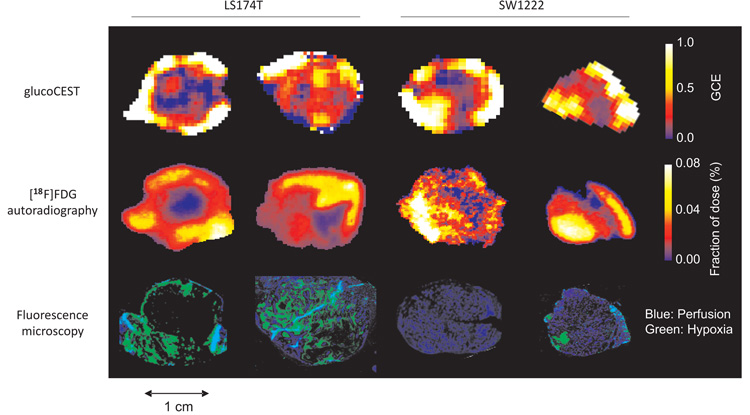
Tumors have a greater reliance on anaerobic glycolysis for energy production than normal tissues. We developed a noninvasive method for imaging glucose uptake in vivo that is based on magnetic resonance imaging and allows the uptake of unlabeled glucose to be measured through the chemical exchange of protons between hydroxyl groups and water. This method differs from existing molecular imaging methods because it permits detection of the delivery and uptake of a metabolically active compound in physiological quantities. We show that our technique, named glucose chemical exchange saturation transfer (glucoCEST), is sensitive to tumor glucose accumulation in colorectal tumor models and can distinguish tumor types with differing metabolic characteristics and pathophysiologies. The results of this study suggest that glucoCEST has potential as a useful and cost-effective method for characterizing disease and assessing response to therapy in the clinic.


Figures

Figure 1
Figure 1
a) Schematic diagram illustrating the principles underlying glucoCEST, showing simulated magnetic resonance frequency spectra with a single glucose (hydroxyl group) and water peak (not to scale). Glucose and water pools with full equilibrium magnetisation are irradiated with a narrow bandwidth radiofrequency pulse, centred at the hydroxyl group resonant frequency, which saturates their magnetisation. Protons in hydroxyl groups then exchange with water protons, transferring their magnetisation, and reducing the signal that can be measured. By continuously saturating the signal from water through this exchange process, thereby further reducing the large water signal, glucoCEST provides an amplification process for the glucose signal. b) In a CEST experiment, the water signal is usually measured as a function of saturation pulse frequency, which is known as the z-spectrum. Simulated z-spectra are shown here, with three hydroxyl group resonances, alongside the asymmetric magnetisation transfer ratio (MTRasym, the difference in signal either side of the water peak centred at 0 p.p.m.). Following glucose injection, the concentration of hydroxyl groups resonating at 1.2, 2.1 and 2.9 p.p.m. from water increases, causing an increase in the size of the hydroxyl peaks in the MTRasym spectrum. The glucoCEST enhancement (GCE) is defined as the change in the area under the MTRasym curve from baseline. (Note that, for simplicity, only the effect of glucose and not of metabolic products of glycolysis are shown.)
Figure 2
Figure 2
a) Example glucoCEST image data from four tumors, showing raw, area under the MTRasym images pre- and 60 minutes post-injection of 1.1 mmol kg−1 glucose solution. Images from two types of human colorectal tumor xenograft models with differing vascular and cellular phenotypes (LS174T and SW1222) are shown. Baseline image contrast reflects variations in water content, endogenous exchangeable protons, lipid signal and conventional magnetisation transfer effects. Also displayed are the corresponding glucoCEST enhancement (GCE) images, which show the change in MTRasym at 60 minutes following glucose injection. b) GCE maps from a cross-section through two mouse xenografts (SW1222), with tumour (T) and paraspinal muscle (M) regions highlighted with arrows. The colour scale represents GCE, whilst underlying greyscale images are for anatomical reference; regions subject to motion during the acquisition (e.g. gut) have been removed from glucose images for clarity. Glucose uptake in the tumour is visibly higher than in the muscle. All data were acquired using the GE-CEST sequence.
Figure 3
Figure 3
Tumor glucose uptake measured using glucoCEST (a) and [18F]FDG autoradiography (b) in two human colorectal tumor xenograft models (SW1222 and LS174T). Uptake of both glucose and FDG was significantly different between tumor types (*, P < 0.01, Mann-Whitney). The central bar in panels a and b shows the mean value, the edges of the box represent quartile values, and the whiskers show the upper and lower range. (c) Scatter plot of median tumor [18F]FDG and glucoCEST enhancement, which shows a significant correlation (P < 0.01, Spearman’s rho). (d) Scatter plot of median Gd-DTPA and glucoCEST enhancement, which are not significantly correlated (P > 0.05, Spearman’s rho). All CEST data were acquired using the GE-CEST sequence.
Figure 4
Figure 4
Example glucoCEST, [18F]FDG autoradiography and fluorescence microscopy images, obtained from the same tumor section (two LS174T and two SW1222 human colorectal xenograft models). Fluorescence microscopy images show perfused (blue) and hypoxic regions (green) corresponding to Hoechst 33342 and pimonidazole staining, respectively. All CEST data in this figure were acquired using the GE-CEST sequence.
Figure 5
Figure 5
a) Example 1H decoupled 13C NMR spectra from SW1222 and LS174T tumors that were administered [U-13C]glucose, following the protocol for glucoCEST experiments. Peak assignments are: 1, lactate C2; 2, glutamate C2; 3, glutamine C2; 4, alanine C2; 5, taurine C1; 6, taurine C2; 7, glutamate C4; 8, lactate C3; 9, alanine C3. An expansion of the C1α multiplet is shown, corresponding to doublets from glucose and glucose-6-phosphate, (chemically shifted by 0.13 p.p.m. from the glucose doublet). Fitted Lorentzian peaks are overlaid overlaid. b) Z- and MTRasym spectra from glucose, glucose 6-phosphate, fructose 6-phosphate and fructose 6,1-biphosphate. In vitro, glucose and glucose-6-phosphate display similar CEST effects, whilst fructose-6-phosphate and fructose 6,1-biphosphate show a smaller effect (Supplemental Fig. 4). c) Z- and MTRasym spectra from glucose, lactate, glutamine, glutamate, alanine and taurine. Glucose displays a strong CEST effect from to hydroxyl proton exchange, whilst the amino acids show a CEST effect via amide proton exchange; lactate shows a minimal effect.

Comment in

References

    1. Ward KM, Balaban RS. Determination of pH using water protons and chemical exchange dependent saturation transfer (CEST) Magn Reson Med. 2000;44:799–802. - PubMed
    1. Kelloff GJ, et al. Progress and promise of FDG-PET imaging for cancer patient management and oncologic drug development. Clin Cancer Res. 2005;11:2785–2808. - PubMed
    1. Chan KW, et al. International Society for Magnetic Resonance in Medicine. Montreal: 2011. Imaging of glucose uptake in breast tumors using non-labeled D-glucose.
    1. Walker-Samuel S, Johnson SP, Pedley RB, Lythgoe MF, Golay X. International Society for Magnetic Resonance in Medicine. Montreal: 2011. Assessment of tumour glucose uptake using gluco-CEST.
    1. El Emir E, et al. Predicting response to radioimmunotherapy from the tumor microenvironment of colorectal carcinomas. Cancer research. 2007;67:11896–11905. - PubMed

Publication types