. 2013 Sep;41(17):8107-25.
doi: 10.1093/nar/gkt589. Epub 2013 Jul 5.

Deciphering the modulation of gene expression by type I and II interferons combining 4sU-tagging, translational arrest and in silico promoter analysis

Affiliations

Deciphering the modulation of gene expression by type I and II interferons combining 4sU-tagging, translational arrest and in silico promoter analysis

Mirko Trilling et al. Nucleic Acids Res. 2013 Sep.

Abstract

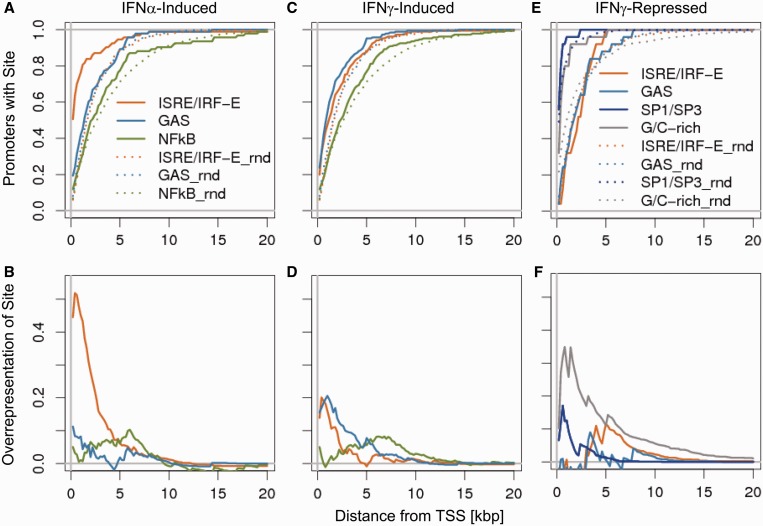
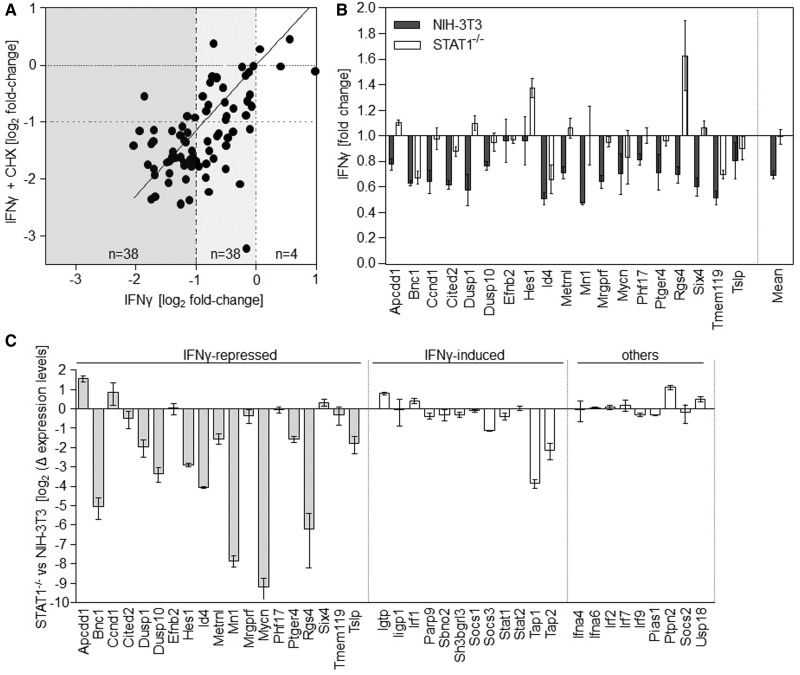
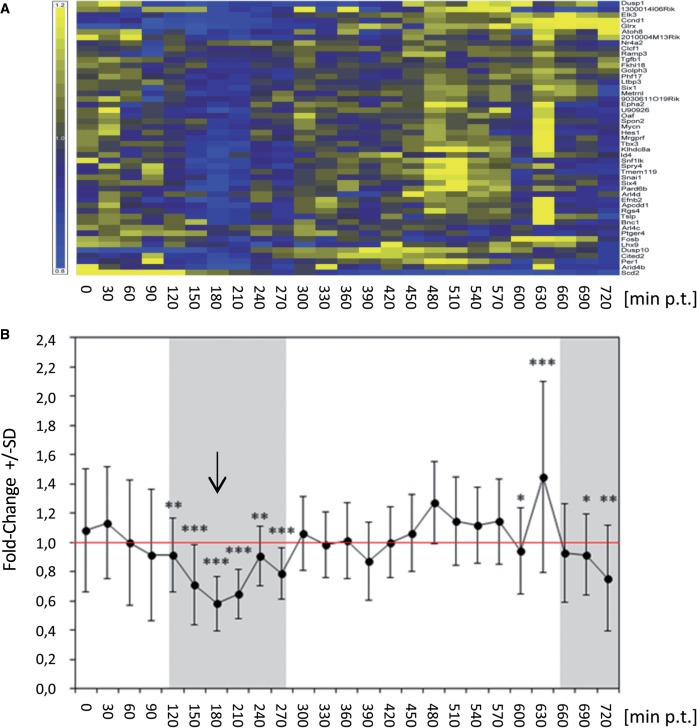
Interferons (IFN) play a pivotal role in innate immunity, orchestrating a cell-intrinsic anti-pathogenic state and stimulating adaptive immune responses. The complex interplay between the primary response to IFNs and its modulation by positive and negative feedback loops is incompletely understood. Here, we implement the combination of high-resolution gene-expression profiling of nascent RNA with translational inhibition of secondary feedback by cycloheximide. Unexpectedly, this approach revealed a prominent role of negative feedback mechanisms during the immediate (≤60 min) IFNα response. In contrast, a more complex picture involving both negative and positive feedback loops was observed on IFNγ treatment. IFNγ-induced repression of genes associated with regulation of gene expression, cellular development, apoptosis and cell growth resulted from cycloheximide-resistant primary IFNγ signalling. In silico promoter analysis revealed significant overrepresentation of SP1/SP3-binding sites and/or GC-rich stretches. Although signal transducer and activator of transcription 1 (STAT1)-binding sites were not overrepresented, repression was lost in absence of STAT1. Interestingly, basal expression of the majority of these IFNγ-repressed genes was dependent on STAT1 in IFN-naïve fibroblasts. Finally, IFNγ-mediated repression was also found to be evident in primary murine macrophages. IFN-repressed genes include negative regulators of innate and stress response, and their decrease may thus aid the establishment of a signalling perceptive milieu.


Figures

Figure 1.
Figure 1.
Experimental setup. (A) Schematic overview of the experimental setup to assess IFN responses by microarray analysis using newly transcribed and total RNA as published in (21). At different times of IFN treatment 4sU was added to cell culture medium for the indicated periods indicated with black horizontal arrows. Total RNA was prepared immediately after the end of labelling and newly transcribed RNA was purified and subjected to microarray analysis. (B) Schematic overview of the new experimental setup to test for the effect of translational inhibition using CHX or mock (DMSO) on IFN-mediated differential gene expression CHX. Fifteen minutes before begin of IFN treatment, CHX pre-treatment was started. Thirty minutes after begin of IFN treatment 4sU was added to cell culture medium to start RNA labelling. Thirty minutes later (=60 min of IFN treatment) total RNA was isolated and newly transcribed RNA was prepared. Three replicates of newly transcribed RNA from each of the six conditions were subjected to microarray analysis. (C) Immunoblot analysis of the signal transduction events in NIH-3T3 cells on incubation with IFNα (100 U/ml) and IFNγ (100 U/ml), respectively, in presence or absence of CHX (50 µg/ml). Cells were pre-treated for 15 min with CHX or DMSO (mock) and subsequently incubated for further 60 min with the indicated IFN. Cells were lysed and lysates were subjected to immunoblot analysis. Membranes were probed with the indicated antibodies.
Figure 2.
Figure 2.
Changes in newly transcribed mRNAs upon inhibition of translation. (A) Expression change (depicted in a log2-scale) of significant changes of probe sets on treatment of CHX. (B, C) Distribution and enrichment of promoter/enhancer elements with respect to the TSS. The upper panel (B) depicts the cumulative percentage of genes harbouring the indicated element in comparison with randomly chosen gene set. The lower panel (C) depicts the enrichment in regulated genes in comparison with 1000 randomly chosen genes by subtracting from the curves shown in the upper panel.
Figure 3.
Figure 3.
Negative feedback mechanisms dominate early IFN responses. (A) Differential regulation by IFNα (light grey) or IFNγ (dark grey) at indicated time points. Each significantly regulated probe set is represented by a dot. (B, C) Effect of CHX on IFN-mediated differential gene expression. The correlation of changes in gene expression in between genes regulated in absence (x-axis) or presence of CHX (y-axis) by either IFNα (B) or IFNγ (C) are depicted in a log2-scale. The insert displays the number of genes and the fold increase (median) owing to inhibition of translation.
Figure 4.
Figure 4.
Temporal resolution (A, B) and co-operative nature (C, D) of TFBS enrichment in relation to transcriptional changes. (A) Percentage of genes harbouring an ISRE/IRF (white bars), a GAS (grey bars) or an NF-κB (black bars) element on IFN incubation within the indicated time frame (0–30, 0–60, 30–60 and 150–180 min of IFNα incubation, respectively) in respect to the individual strength of induction (more than two-, four-, eight- and 16-fold). (B) The same figure as in A, but for IFNγ. The median fold induction (depicted in a log2-scale) for IFNα- (C) and IFNγ-induced genes (D) is shown in respect to the number of ISRE/IRF or GAS elements in their promoter/enhancer (0, 1 or >1) on IFN incubation in absence (upper panel) or presence (lower panel) of CHX. The P-value of the correlation between number of sites and induction is indicated in the diagrams.
Figure 5.
Figure 5.
Positional distribution of TFBS. Distribution and enrichment of elements [ISRE/IRF (orange), GAS (light blue), NF-κB (green), SP1/SP3 (dark blue) and G/C-rich (grey)] in respect to the TSS for IFNα-induced (A, B), IFNγ-induced (C, D) and IFNγ-repressed (E, F) genes. Curves derived from regulated genes are shown as straight lines and the non-regulated control genes are depicted as dotted lines. The Upper panel (A, C, E) shows the additive percentage of genes harbouring the indicated element in comparison with randomly chosen gene set. The lower panel (B, D, F) depicts the over-representation of elements in the regulated genes in comparison to the non-regulated genes by subtracting of the curves shown in the upper panel.
Figure 6.
Figure 6.
IFNγ-mediated gene repression depends on STAT1. (A) Comparison of genes repressed by IFNγ (30–60 min) in presence (y-axis) and absence (x-axis) of CHX. The number of regulated genes within the rectangles illustrated in different grey scales are indicated. (B, C) nCounter analysis of the effect of IFNγ on 50 marker genes in NIH-3T3 and STAT1−/− fibroblasts. Cells were treated with 100 U/ml of IFNγ or mock for 60 min. In all, 500 µM 4sU was added from 30 to 60 min of treatment. Newly transcribed RNA was purified and subjected to nCounter measurements for transcripts of 50 selected genes. Data were normalized based on seven house-keeping genes showing stable expression levels in both cell lines. For 19 IRepGs (B), combined data from two independent experiments, consisting of two biological replicates are shown. Although expression of 17/19 IRepGs was observed in NIH-3T3, only 4/19 genes showed >20% reduced expression levels in the STAT1−/− cells (Fisher’s exact test: P < 0.0001). (C) Dependency of gene expression on STAT1 in IFNγ-naïve cells. nCounter measurements of basal expression levels in NIH-3T3 and STAT1−/− fibroblasts are shown. Expression of 11/19 (58%) of the IRepGs but only two of the 21 other genes (9%) was dependent on STAT1 (Fisher’s exact test: P = 0.0019).
Figure 7.
Figure 7.
Transient down regulation of IRepGs in primary mouse bone marrow derived macrophages. In a recently published study (58), mouse BMDM were treated with 10 U/ml IFNγ. Cells were lysed with Trizol every 30 min during the first 12 h of treatment and the obtained RNA samples were hybridized to Mouse Agilent V2 arrays. Gene probes matching to the list of IRepGs we identified in murine fibroblasts were identified and ‘per gene normalized’ values were calculated from log2 expression values. (A) Heat map of ‘per gene normalized’ log2 expression values over the 12 h time course post-treatment (p.t.) are shown. Gene probes were clustered by Euclidean distance (Yellow—upregulated, Blue—downregulated). (B) Line graph of mean per gene normalized log2 expression values. The arrow indicates the time point showing the strongest down regulation.

References

    1. Isaacs A, Lindenmann J. Virus interference. I. The interferon. Proc. R. Soc. Lond B Biol. Sci. 1957;147:258–267. - PubMed
    1. Casrouge A, Zhang SY, Eidenschenk C, Jouanguy E, Puel A, Yang K, Alcais A, Picard C, Mahfoufi N, Nicolas N, et al. Herpes simplex virus encephalitis in human UNC-93B deficiency. Science. 2006;314:308–312. - PubMed
    1. Dupuis S, Jouanguy E, Al Hajjar S, Fieschi C, Al Mohsen IZ, Al Jumaah S, Yang K, Chapgier A, Eidenschenk C, Eid P, et al. Impaired response to interferon-alpha/beta and lethal viral disease in human STAT1 deficiency. Nat. Genet. 2003;33:388–391. - PubMed
    1. Jouanguy E, Altare F, Lamhamedi S, Revy P, Emile JF, Newport M, Levin M, Blanche S, Seboun E, Fischer A, et al. Interferon-gamma-receptor deficiency in an infant with fatal bacille Calmette-Guerin infection. N. Engl. J. Med. 1996;335:1956–1961. - PubMed
    1. Zhang SY, Jouanguy E, Ugolini S, Smahi A, Elain G, Romero P, Segal D, Sancho-Shimizu V, Lorenzo L, Puel A, et al. TLR3 deficiency in patients with herpes simplex encephalitis. Science. 2007;317:1522–1527. - PubMed

Publication types

MeSH terms

Associated data