Review
. 2014 Feb;49(1):88-102.
doi: 10.1007/s12035-013-8489-4. Epub 2013 Jul 7.

Integrating pathways of Parkinson's disease in a molecular interaction map

Affiliations
Review

Integrating pathways of Parkinson's disease in a molecular interaction map

Kazuhiro A Fujita et al. Mol Neurobiol. 2014 Feb.

Abstract

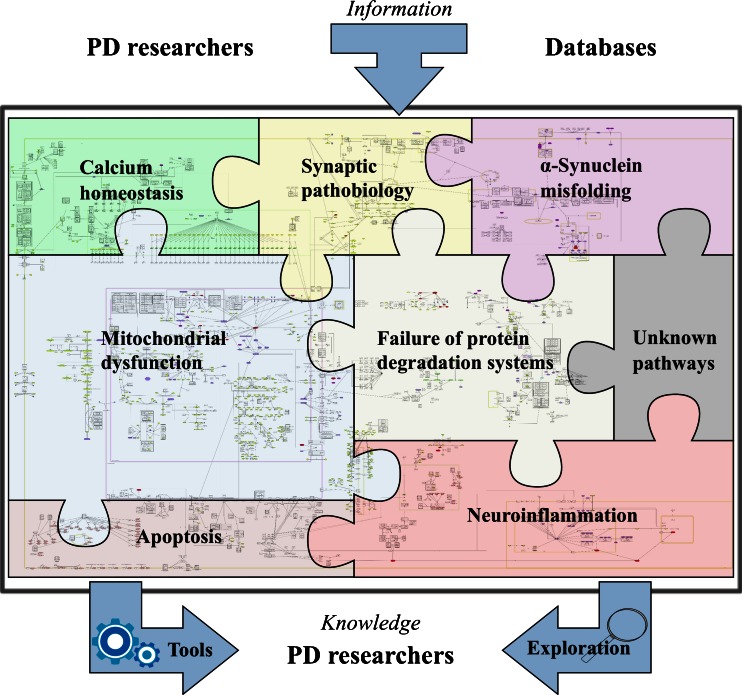
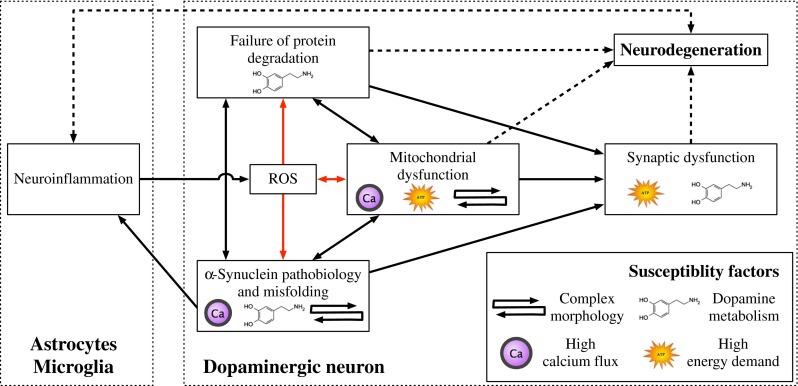
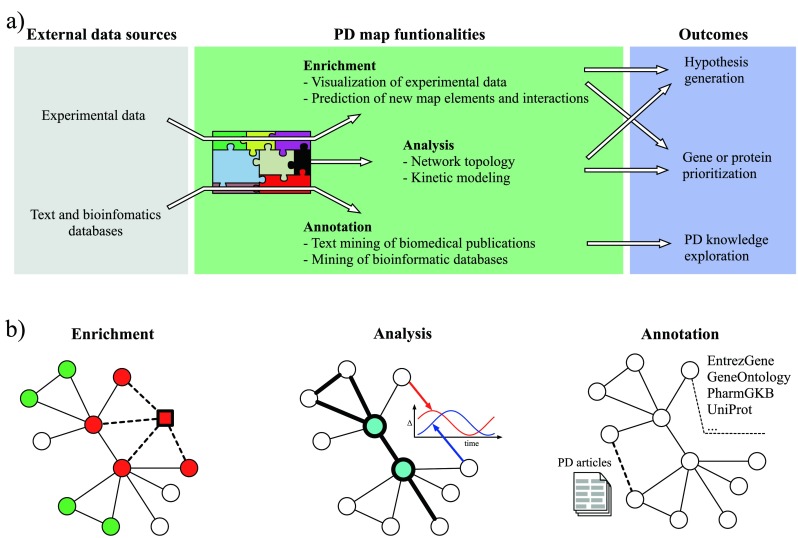
Parkinson's disease (PD) is a major neurodegenerative chronic disease, most likely caused by a complex interplay of genetic and environmental factors. Information on various aspects of PD pathogenesis is rapidly increasing and needs to be efficiently organized, so that the resulting data is available for exploration and analysis. Here we introduce a computationally tractable, comprehensive molecular interaction map of PD. This map integrates pathways implicated in PD pathogenesis such as synaptic and mitochondrial dysfunction, impaired protein degradation, alpha-synuclein pathobiology and neuroinflammation. We also present bioinformatics tools for the analysis, enrichment and annotation of the map, allowing the research community to open new avenues in PD research. The PD map is accessible at http://minerva.uni.lu/pd_map .


Figures

Fig. 1
Fig. 1
The concept of Parkinson's disease map and its possibilities. The PD map is a knowledge repository bringing together different molecular mechanisms and pathways considered to be the key players in the disease. The current focus of the map is illustrated by the pieces in the “PD puzzle” These modules include synaptic and mitochondrial dysfunction, failure of protein degradation systems, α-synuclein pathobiology and misfolding, and neuroinflammation. Processes important in PD-associated neurodegeneration, such calcium homeostasis or apoptosis, are discussed within their appropriate context in the main text, and included into the PD map pathways. The PD map is represented as a graph constructed with all gene-regulatory protein and metabolic interactions extracted from published data. Currently the map has 2,285 elements and 989 reactions supported by 429 articles and 254 entries from publicly available bioinformatic databases. It is compliant with standardized graphical representation, Systems Biology Graphical Notation (SBGN) [265]. This standardized representation of the map could become a common language for the PD research community to discuss disease-related molecular mechanisms [5]. Detailed contents of the PD map are accessible at http://minerva.uni.lu/MapViewer/map?id=pdmap (Online resource 1) as an SBML file (Online resource 2) and in Payao [264]. The map can be updated with information from the PD research community, as well as by searching bioinformatics databases. Exploration and analysis of the content has the potential to broaden knowledge on the molecular processes in PD, generate of new hypotheses on disease pathogenesis, or prioritize the most interesting areas and molecules for investigation. Approaches to facilitate this knowledge acquisition process are discussed in detail in the section “Annotation, enrichment and Analysis of the PD Map”
Fig. 2
Fig. 2
Pathways implicated in PD and their relationship to susceptibility factors of SNpc DA neurons. The black arrows represent direct molecular interactions between the dysregulated pathways. Red arrows denote pathways affected by or generating ROS. Dashed lines represent indirect associations of these pathways and neurodegeneration. Susceptibility factors of SNpc DA neurons associated with a given pathway are indicated by their corresponding symbols
Fig. 3
Fig. 3
The workflow and an illustration of PD map functionalities. a The PD map can be automatically enriched with experimental data and annotated with information from text and bioinformatics databases. The analysis requires no external data sources. b A simplified representation of the PD map is given, with circles (nodes) as map elements and lines (edges) as interactions (uni- or bi-directional). Enrichment: green and red nodes represent up- and downregulated genes, respectively, derived from experimental data; a predicted new map component (square) shares interaction with existing map components (dashed lines) and matches their expression profile. Analysis: nodes with high centrality (blue) play a key role in the network topology and indicate molecules regulating many processes; detection of paths (thick lines) highlights non-trivial relations between elements of a biological process; kinetic modelling reveals temporal dependencies between behaviour of different molecules. Annotation: text mining of PD-related articles suggests new interactions in the map (thick dashed line) and facilitates handling of a huge number of publications; each map element is annotated with information from various bioinformatics databases giving easy access to information about interesting elements

References

    1. Obeso JA, Rodriguez-Oroz MC, Goetz CG, et al. Missing pieces in the Parkinson’s disease puzzle. Nat Med. 2010;16:653–661. - PubMed
    1. Caron E, Ghosh S, Matsuoka Y, et al. A comprehensive map of the mTOR signaling network. Mol Syst Biol. 2010;6:453. - PMC - PubMed
    1. Mizuno S, Iijima R, Ogishima S, et al. AlzPathway: a comprehensive map of signaling pathways of Alzheimer’s disease. BMC Syst Biol. 2012;6:52. - PMC - PubMed
    1. Ghosh S, Matsuoka Y, Asai Y, et al. Software for systems biology: from tools to integrated platforms. Nat Rev Genet. 2011;12:821–832. - PubMed
    1. Kitano H, Ghosh S, Matsuoka Y. Social engineering for virtual “big science” in systems biology. Nat Chem Biol. 2011;7:323–326. - PubMed