. 2013 Aug;61(8):1331-46.
doi: 10.1002/glia.22518. Epub 2013 Jul 6.

Carcinoma cells misuse the host tissue damage response to invade the brain

Affiliations
Free PMC article

Carcinoma cells misuse the host tissue damage response to invade the brain

Han-Ning Chuang et al. Glia. 2013 Aug.
Free PMC article

Abstract

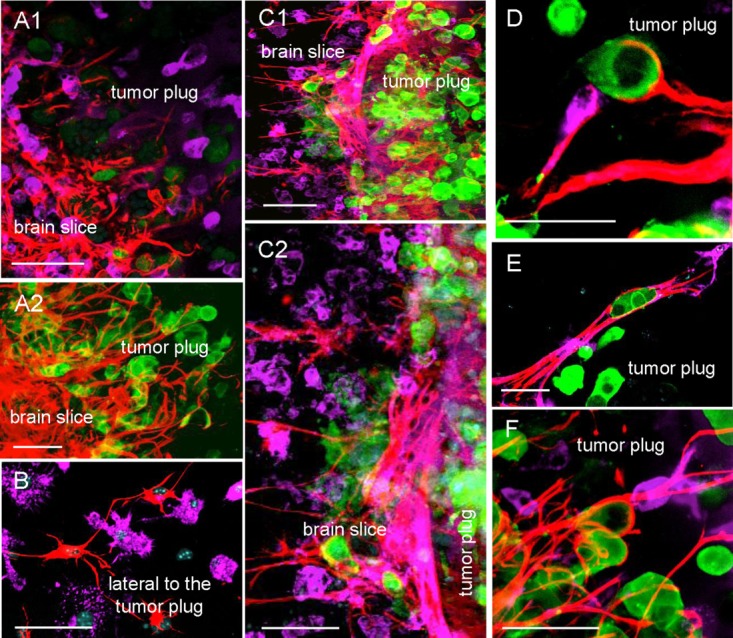
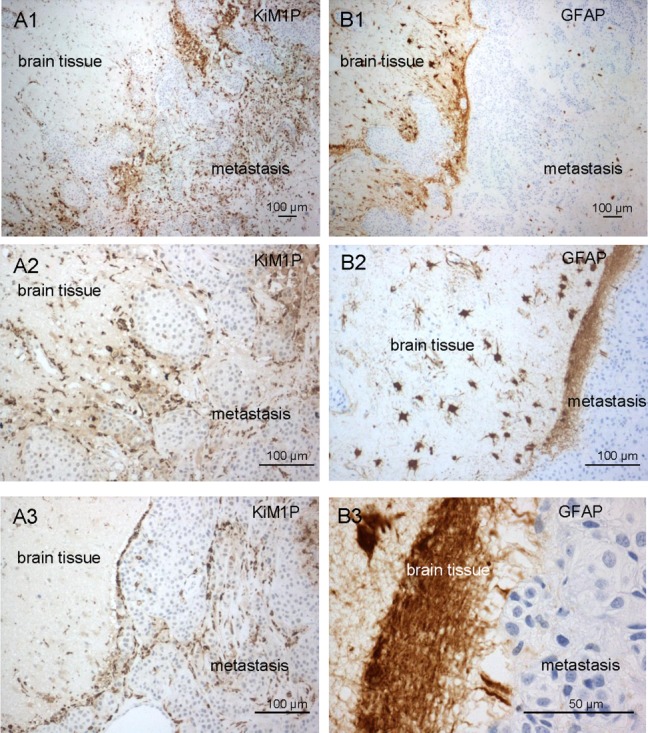
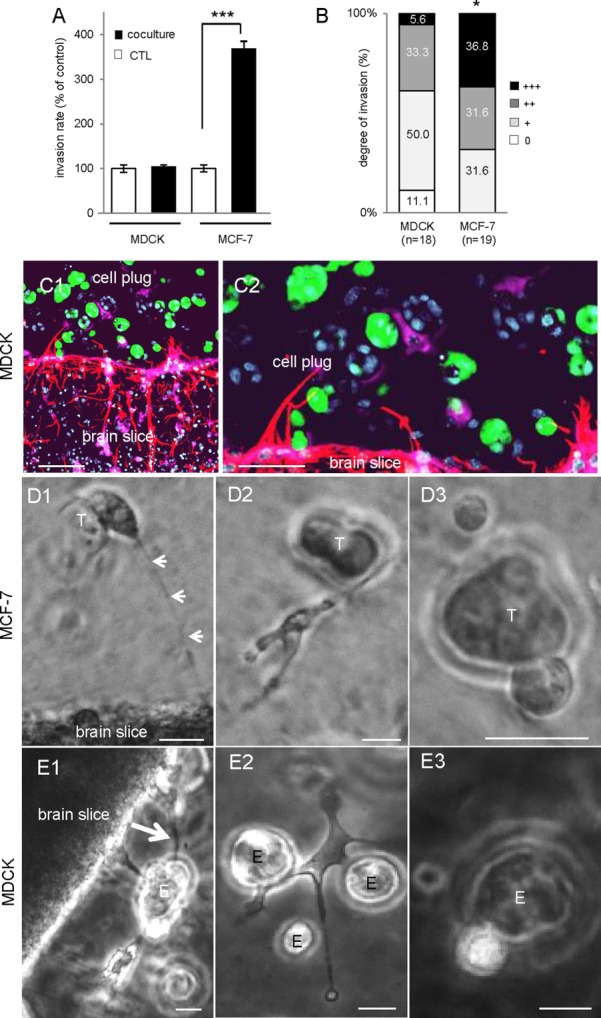
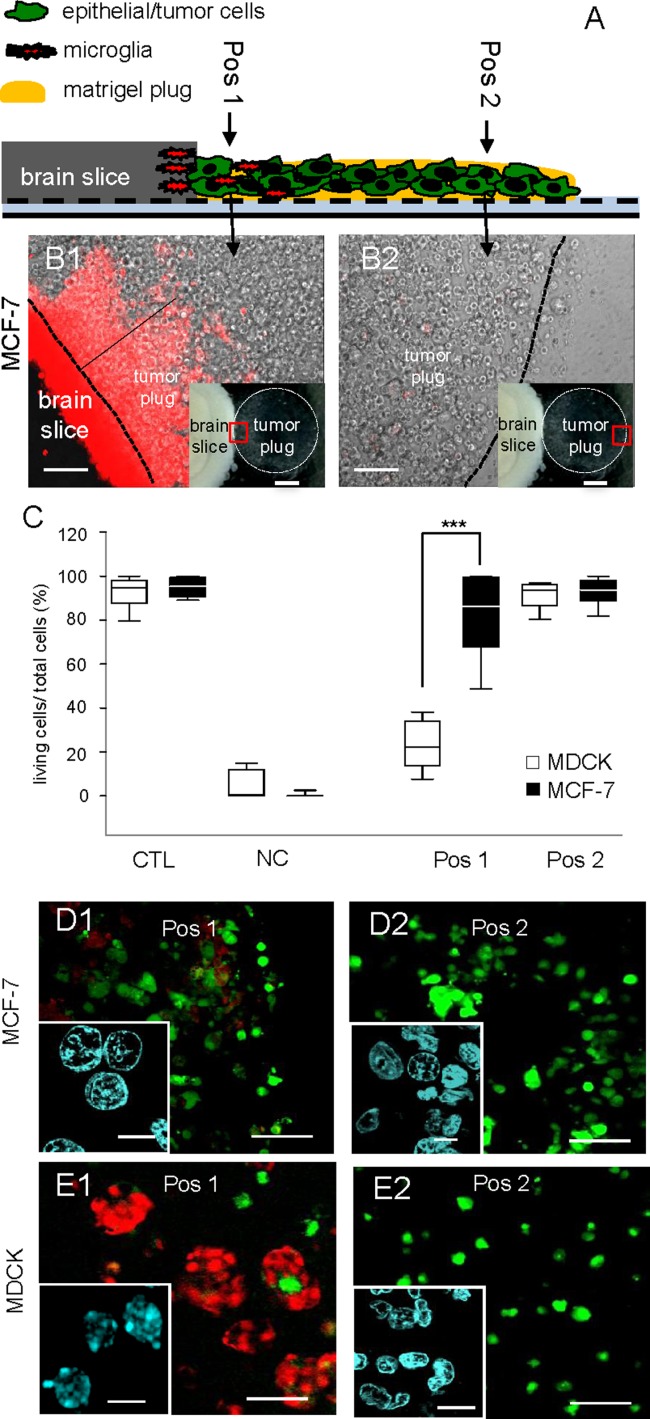
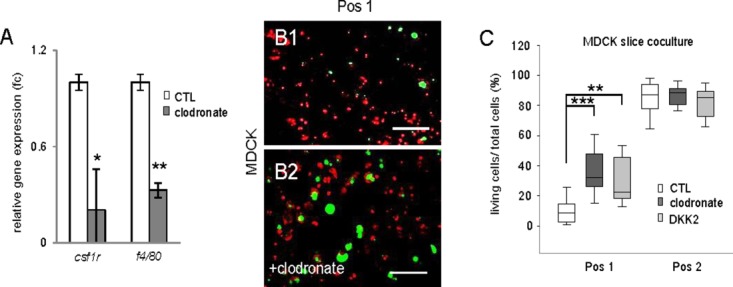
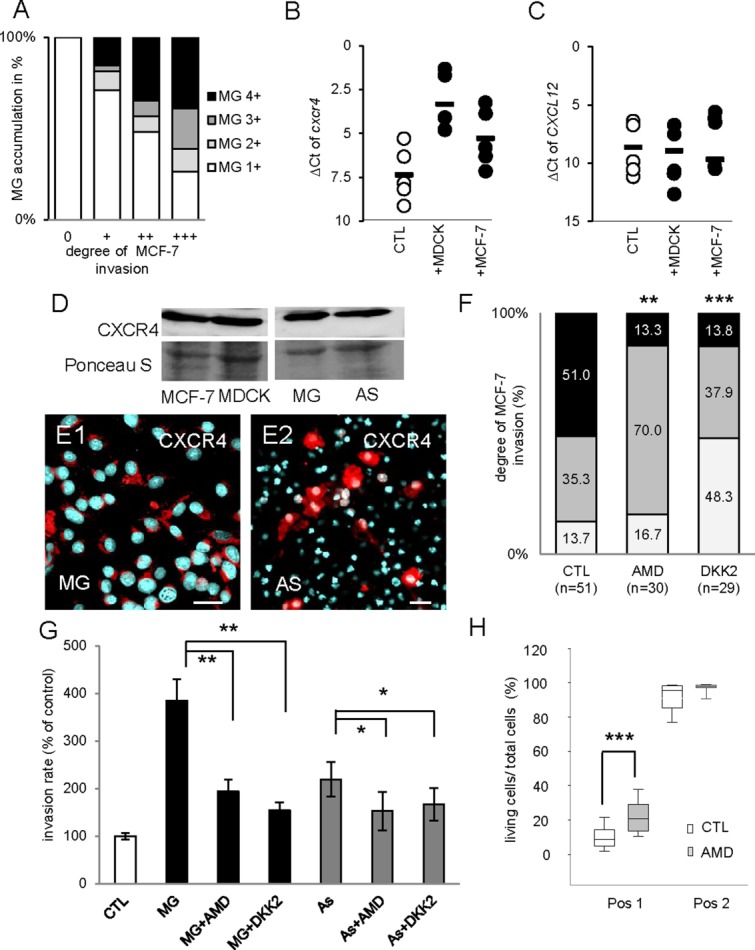
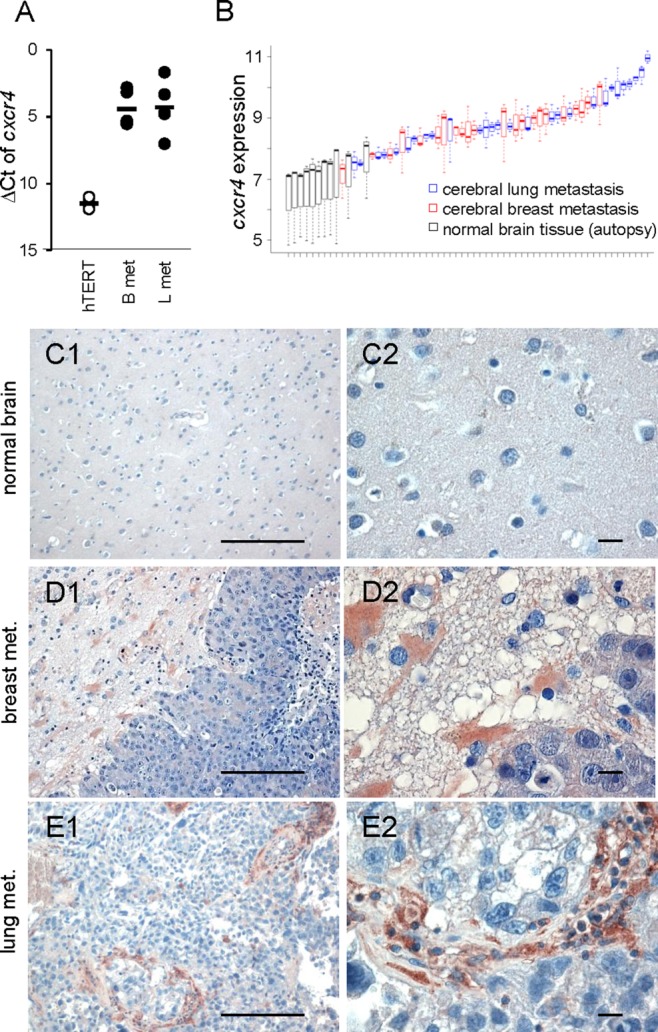
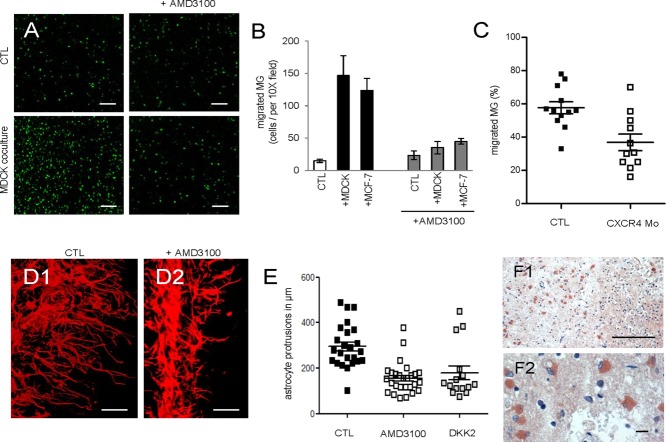
The metastatic colonization of the brain by carcinoma cells is still barely understood, in particular when considering interactions with the host tissue. The colonization comes with a substantial destruction of the surrounding host tissue. This leads to activation of damage responses by resident innate immune cells to protect, repair, and organize the wound healing, but may distract from tumoricidal actions. We recently demonstrated that microglia, innate immune cells of the CNS, assist carcinoma cell invasion. Here we report that this is a fatal side effect of a physiological damage response of the brain tissue. In a brain slice coculture model, contact with both benign and malignant epithelial cells induced a response by microglia and astrocytes comparable to that seen at the interface of human cerebral metastases. While the glial damage response intended to protect the brain from intrusion of benign epithelial cells by inducing apoptosis, it proved ineffective against various malignant cell types. They did not undergo apoptosis and actually exploited the local tissue reaction to invade instead. Gene expression and functional analyses revealed that the C-X-C chemokine receptor type 4 (CXCR4) and WNT signaling were involved in this process. Furthermore, CXCR4-regulated microglia were recruited to sites of brain injury in a zebrafish model and CXCR4 was expressed in human stroke patients, suggesting a conserved role in damage responses to various types of brain injuries. Together, our findings point to a detrimental misuse of the glial damage response program by carcinoma cells resistant to glia-induced apoptosis.

Keywords: astrocytes; brain metastasis; damage response; glia; invasion; microglia.


Figures

Figure 1
Figure 1
Astrocytes and microglia are part of gliosis and interact with MCF-7 in the slice cocultures. (A–F) Double staining of the coculture with the organotypic brain slice and MCF-7-GFP (green) in the 3D-tumor plug were applied for astrocytes (anti-GFAP-TRITC = red) and microglia (ILB4-Alexa Fluor 647 = violet), except (A2) is only a single astrocytic staining for better illustration (A1 and A2) The astrocytes form a mesh in the tumor plug contacting the MCF-7 cells with their protrusions. Interestingly, these astrocytes remain connected with other astrocytes and the brain tissue. (B) A lateral part of the brain slice which is adjacent to the tumor plug. In contrast to astrocytes, microglia leave the brain slice as individual cells (A1, B). In the brain tissue, both glial cells are activated at the invasion zone, especially the astrocytes attempt to form a dense barrier in the brain slice next to the tumor plug (C1 and the contact area in higher magnification C2). (D–F) These examples illustrate frequently detectable interactions of astrocytes and microglia with the same MCF-7 cells in the tumor plug. Scale bars represent 50 µm. [Color figure can be viewed in the online issue, which is available at wileyonlinelibrary.com.]
Figure 2
Figure 2
Distribution of microglia and astrocytes in human brain metastases. The reaction of the microglia and astrocytes in human brain metastasis samples is comparable to the brain slice coculture system. A1–A3) Macrophage/microglia staining was performed employing the anti-KiM1P antibody. Activated macrophages/microglia accumulate in the adjacent brain tissue and at the interface. The majority of the activated macrophages/microglia infiltrate into the metastatic tissue. (B1–B3) Astrocyte response was demonstrated by GFAP IHC staining. Activated astrocytes accumulate in the adjacent brain tissue and form a barrier at the interface to the metastatic tissue. Furthermore, comparable to the brain slice coculture system, only few cells enter the tumor mass. [Color figure can be viewed in the online issue, which is available at wileyonlinelibrary.com.]
Figure 3
Figure 3
Comparison of the astrocytic and microglial reactions as well as their effects on benign and malignant epithelial cells. (A) Boyden chamber assays were performed with malignant MCF-7 or epithelial (benign) MDCK cells ± indirect microglia coculture. Data represent mean ± SEM with n ≥ 9. (B) Cocultures with 3D-MCF-7-GFP or 3D-MDCK-GFP cells. Data represent the degree of MCF-7 or MDCK invasion into the brain slice at the contact area after 96 h. (C) Double stainings of astrocytes (anti-GFAP-TRITC = red) and microglia (ILB4-Alexa Fluor 647 = violet) of the MDCK-GFP (green) coculture. The gliosis reaction of astrocytes and microglia was comparable to the MCF-7 coculture (see Fig. 1D), however, MDCK did not invade the slice (scale bars represent 50 µm). (D and E) Excerpts of time-lapse experiments illustrating three different microglial subtypes in MCF-7 and MDCK cocultures (T = MCF-7 cells; E = MDCK cells, white arrows = protrusions). Subtype A: microglia resident in the brain slice with long protrusions into the 3D-plug (D1 and E1). Subtype B: individual microglia in the plug forming short contacts (D2 and E2). Subtype C: round microglia directly attach to epithelial cell surface over a long period (D3 and E3). This kind of microglia sometimes transports both epithelial cell types (scale bars represent 20 µm). [Color figure can be viewed in the online issue, which is available at wileyonlinelibrary.com.]
Figure 4
Figure 4
Astrocyte and microglia interaction leads to MDCK apoptosis while MCF-7 survives. (A) Scheme of the experimental procedures: the Position 1 (Pos 1) is directly adjacent to the brain slice; Position 2 (Pos 2) is at the contralateral side of the plug. (B) Representative phase contrast images of coculture time-lapse experiments with live microglial staining (red = ILB4-Alexa Fluor 568). At Pos 1 (B1), microglia leave the brain slice and distance themselves with a maximum of 600–800 µm from the brain slice edge, thus microglia are absent at Pos 2 (B2) (scale bars represent 200 µm). Inlays: the red rectangles illustrate the positions in the tumor plug (scale bars represent 1 mm). (C) Image J quantification: the box plots indicate the percentage of living cells compared with total cells. Monocultured cell/tumor plugs served as positive controls (CTL) and UV-irradiated cell/tumor plugs served as negative controls (NC). At Pos 1 MDCK viability was reduced significantly, in contrast MCF-7 cells demonstrated no significant change toward CTL or both positions (data represent mean ± SEM with n ≥ 9). (D and E) Representative confocal images of the live (Calcein-AM = green) and dead (PI = red) staining of the epithelial cell/tumor plugs (scale bars represent 100 µm), including the nuclei morphology (DAPI = blue, in the insert, scale bars represent 10 µm) were shown. [Color figure can be viewed in the online issue, which is available at wileyonlinelibrary.com.]
Figure 5
Figure 5
Microglia depletion and addition of DKK2 partially rescue MDCK apoptosis. (A) Clodronate (100 µg/mL) effectively reduced the microglial markers csf1r and f4/80 in whole brain slices after 48 h of stimulation. Gene expression levels were normalized to the average of the respective housekeeping genes and expressed as fold changes (fc). Data represent mean ± SEM with n ≥ 9 of three individual experiments. (B1 and B2) Representative confocal images of the live (Calcein-AM = green) and dead (PI = red) staining of the epithelial MDCK cells at Position 1. Microglia depletion leads to a partial rescue of MDCK viability after clodronate treatment (scale bars represent 100 µm). (C) Image J quantification: Clodronate or DKK2 treatment resulted in a partial rescue of the glia-induced MDCK apoptosis at Position 1. Data represent mean ± SEM with n ≥ 9 of three individual experiments. [Color figure can be viewed in the online issue, which is available at wileyonlinelibrary.com.]
Figure 6
Figure 6
CXCR4 and WNT signaling are involved in microglia- and astrocyte-induced invasion. (A) The degree of MCF-7 invasion and microglia (MG) accumulation at the contact area/invasion front was determined in brain slice cocultures (n = 203). The analysis revealed a significant correlation between the degree of tumor invasion and the degree of microglial accumulation (Spearman’s test; P <  0.001). (B and C) qRT-PCR results of cxcr4 and cxcl12 illustrated by the ΔCt method. Coculture with MDCK or MCF-7 cells for 96 h upregulates cxcr4 but not its ligand, cxcl12 in the organotypic brain slices. Line represents the mean value of all experiments and each dot represents the mean value of triplicate analyses with n ≥ 15 from three individual experiments. (D) MDCK, MCF-7, microglia, and astrocytes (AS) express CXCR4 protein detected by immunoblot. (E1 and E2) The glial cells astrocytes and microglia reveal a heterogeneous expression pattern of CXCR4 (red) on immunofluorescence staining counterstained with DAPI (scale bars represent 20 µm). (F) The invasion of the MCF-7-GFP cells into the whole brain slice was significantly reduced after DKK2 as well as AMD3100 treatment. (G) The influence of indirect cocultures with microglia or astrocytes on carcinoma cell invasion measured by modified Boyden chamber assays. Treatment with WNT inhibitor DKK2 as well as CXCR4 inhibitor AMD3100 significantly reduced both the astrocyte- or microglia-induced carcinoma cell invasion. Data represent mean ± SEM with n ≥ 9 of three individual experiments. (H) The CXCR4 inhibitor also partially rescued the glial-induced apoptosis of MDCK at Position 1 (scheme see Fig. 4A) similar to clodronate or DKK2 treatment shown in Fig. 5C. Data represent mean ± SEM with n ≥ 9 from more than three individual experiments. [Color figure can be viewed in the online issue, which is available at wileyonlinelibrary.com.]
Figure 7
Figure 7
CXCR4 expression in astrocytes and microglia in human brain metastasis samples. (A) qRT-PCR results of cxcr4 illustrated by the ΔCt method. Human cerebral lung (L met) and breast cancer (B met) metastases samples demonstrate a marked expression of CXCR4 in contrast to the benign epithelial cell line hTERT. Line represents the mean and each dot represents the mean value of triplicate analyses with n ≥ 15. (B) Gene expression of cxcr4 is visualized using boxplots across all samples for the three different cxcr4 probes (209201_x_at, 217028_at, 211919_s_at). Samples are ordered by means of cxcr4 gene expression. Black: normal brain tissues, red: cerebral breast metastases, and blue: cerebral lung metastases. (C–E) Expression and localization of CXCR4 were analyzed in normal brains, cerebral metastasis of breast and lung cancer samples by immunohistochemistry. In normal brains, CXCR4 was undetectable (C), whereas in cerebral metastases, CXCR4 expression was detectable in the metastatic cells, the metastatic stroma, and especially in astrocytes in the gliosis region adjacent to the tumor cells (D and E) (scale bars represent 20 µm, in the left panel 200 µm). [Color figure can be viewed in the online issue, which is available at wileyonlinelibrary.com.]
Figure 8
Figure 8
CXCR4 knockdown/ inhibition affects microglial and astrocytic damage response. (A and B) Results of the microglia chemotaxis assays toward MDCK and MCF-7 cells. Both cocultures significantly enhanced microglia migration. (A) Representative microglial images were shown ± MDCK coculture and ± treatment with the CXCR4 inhibitor (AMD 3100, 1 µg/mL). AMD3100 reduced the enhanced microglial migration toward MDCK almost to CTL level (scale bars represent 200 µm). (B) Results demonstrate migrated microglial cells per 10× field, data represent mean ± SEM; n = 40. (C) Knockdown effects of CXCR4 in zebrafish larvae: Percentage of microglia in the optic tectum moving to the injury site in CTL (n = 12) and CXCR4-morpholino (CXCR4-Mo) injected embryos (n = 11) were measured. The CXCR4-Mo significantly reduced the microglial migration toward the injury site (line = mean and SEM, P = 0.004). (D and E) Cocultured with 3D-MCF-7-GFP for 96 h ± 1 µg/mL of AMD3100 were stained with anti-GFAP-TRITC (red). The length of the astrocyte protrusions were reduced after AMD3100 (P <  0.001) or DKK2 (P = 0.009) treatment (scale bars represent 100 µm); line = mean and SEM (n ≥ 15). (F) Protein expression of CXCR4 in human stroke samples using IHC (scale bar represents 20 µm, in the upper panel 200 µm). [Color figure can be viewed in the online issue, which is available at wileyonlinelibrary.com.]

References

    1. Allavena P, Sica A, Garlanda C, Mantovani A. The Yin-Yang of tumor-associated macrophages in neoplastic progression and immune surveillance. Immunol Rev. 2008;222:155–161. - PubMed
    1. Balkwill F, Charles KA, Mantovani A. Smoldering and polarized inflammation in the initiation and promotion of malignant disease. Cancer Cell. 2005;7:211–217. - PubMed
    1. Barrett T, Edgar R. Mining microarray data at NCBI’s Gene Expression Omnibus (GEO)*. Methods Mol Biol. 2006;338:175–190. - PMC - PubMed
    1. Bezzi P, Domercq M, Brambilla L, Galli R, Schols D, De CE, Vescovi A, Bagetta G, Kollias G, Meldolesi J, Volterra A. CXCR4-activated astrocyte glutamate release via TNFalpha: Amplification by microglia triggers neurotoxicity. Nat Neurosci. 2001;4:702–710. - PubMed
    1. Bingle L, Brown NJ, Lewis CE. The role of tumour-associated macrophages in tumour progression: Implications for new anticancer therapies. J Pathol. 2002;196:254–265. - PubMed

Publication types

MeSH terms

LinkOut - more resources