. 2013 Aug;36(2):177-84.
doi: 10.1007/s10059-013-0061-6. Epub 2013 Jul 4.

TrkC promotes survival and growth of leukemia cells through Akt-mTOR-dependent up-regulation of PLK-1 and Twist-1

Affiliations

TrkC promotes survival and growth of leukemia cells through Akt-mTOR-dependent up-regulation of PLK-1 and Twist-1

Min Soo Kim et al. Mol Cells. 2013 Aug.

Abstract

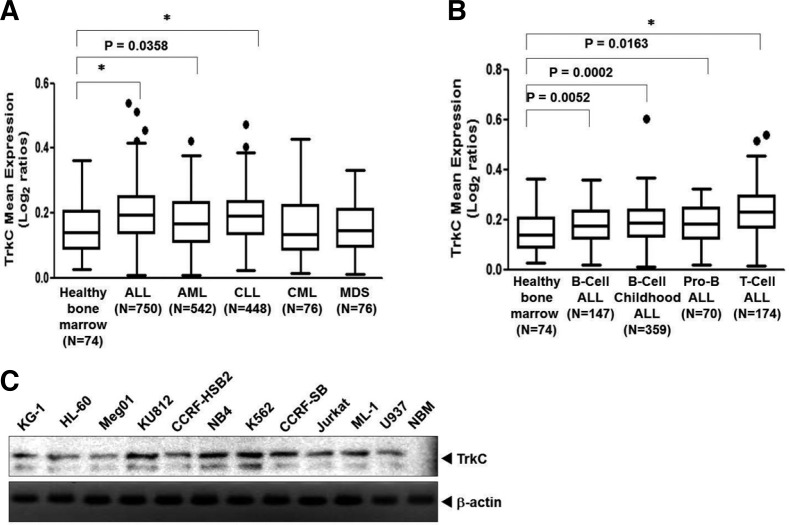
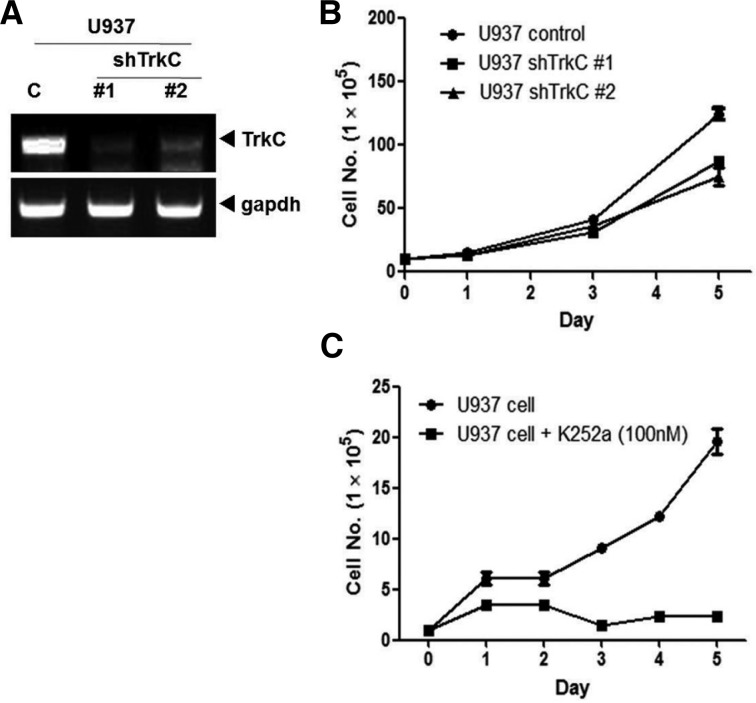
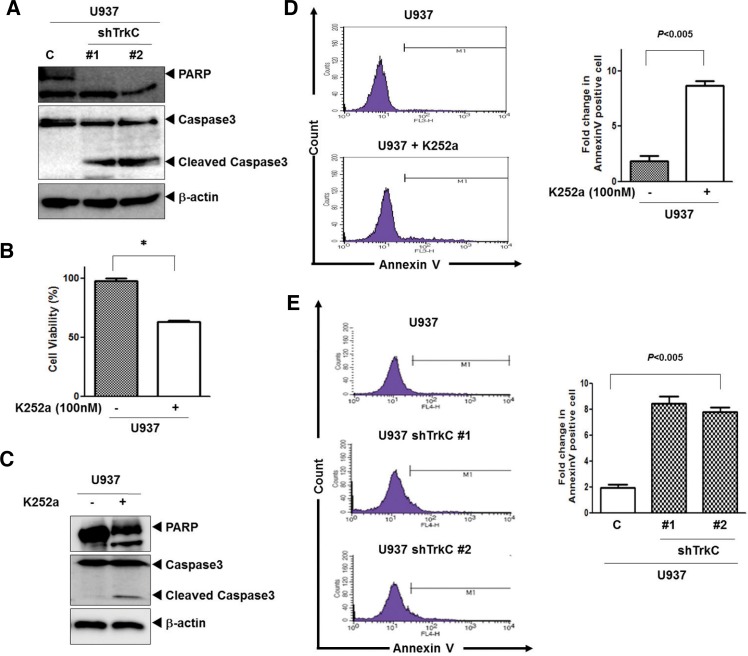
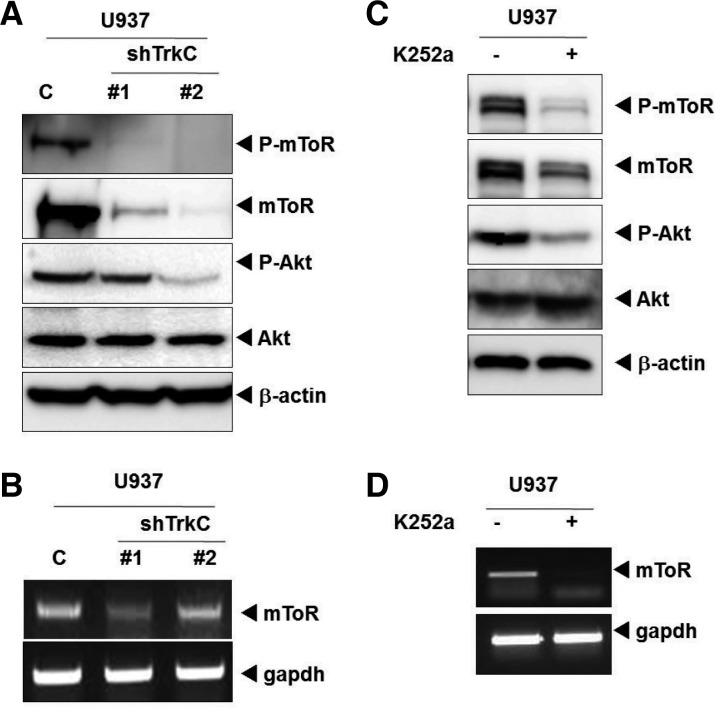
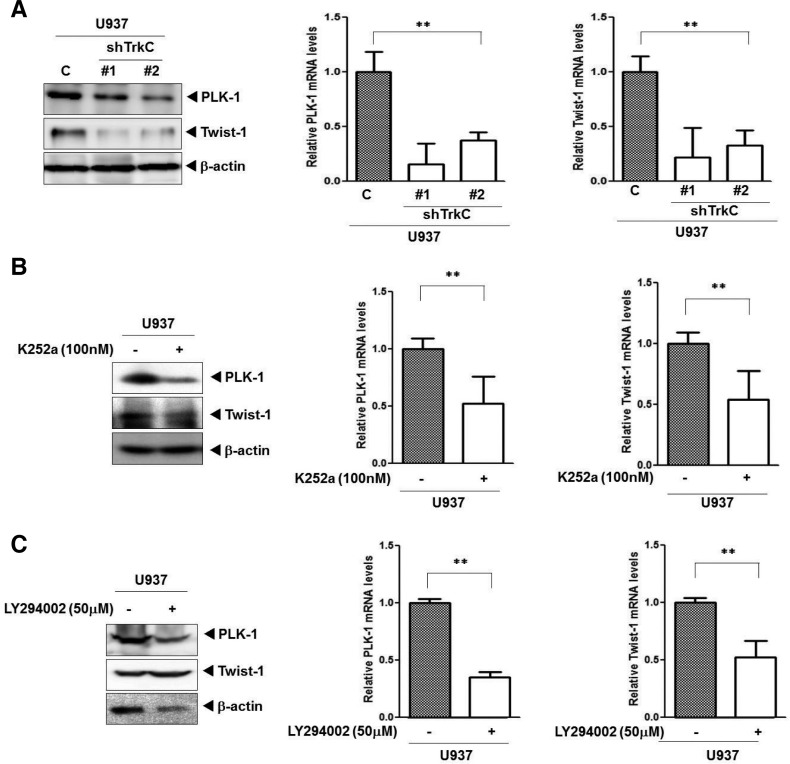
It has been suggested that activation of receptor PTKs is important for leukemogenesis and leukemia cell response to targeted therapy in hematological malignancies including leukemia. PTKs induce activation of the PI3K/Akt/mTOR pathway, which can result in prevention of apoptosis. Here, we describe an important role of the TrkC-associated molecular network in the process of leukemogenesis. TrkC was found to be frequently overexpressed in human leukemia cells and leukemia subtypes. In U937 human leukemia cells, blockade of TrkC using small hairpin RNA (shRNA) specific to TrkC or K562a, a specific inhibitor of TrkC, resulted in a significant decrease in growth and survival of the cells, which was closely associated with reduced mTOR level and Akt activity. In addition, TrkC enhances the survival and proliferation of leukemia, which is correlated with activation of the PI3K/Akt pathway. Moreover, TrkC significantly inhibits apoptosis via induction of the expression of PLK-1 and Twist-1 through activation of AKT/mTor pathway; therefore, it plays a key role in leukemogenesis. These findings reveal an unexpected physiological role for TrkC in the pathogenesis of leukemia and have important implications for understanding various hematological malignancies.


Figures

Fig. 1.
Fig. 1.
TrkC is overexpressed in human leukemia cells. (A) TrkC gene expression is correlated with leukemia subtypes. The gene expression data were plotted as box plots of the mean expression of the TrkC gene. The TrkC gene level was extracted from the dataset and averaged in each tumor. Values represent the log2 ratio over control. The one-way ANOVA significance for each plot was P < 0.0001. *P < 0.0001 as determined by a Student’s t-test. (B) TrkC gene expression is correlated with human Acute Lymphoblastic Leukemia (ALL) subtypes. The gene expression data were plotted as box plots of the mean expression of the TrkC gene. The TrkC gene level was extracted from the dataset and averaged in each tumor. Values represent the log2 ratio over control. The one-way ANOVA significance for each plot was P < 0.0001. *P < 0.0001 as determined by a Student’s t-test. (C) The expression of TrkC protein in a panel of human normal bone marrow (NBM) and leukemia cell lines was examined by immunoblotting analysis. The endogenous β-actin level was measured as an internal control. NBM, Normal bone marrow.
Fig. 2.
Fig. 2.
Suppression of TrkC expression with stable TrkC-shRNA reduces cell proliferation. (A) The expression of TrkC was examined by RT-PCR in U937 cells stably expressing control-shRNA, TrkC-shRNA #1, and TrkC-shRNA #2. GAPDH was used as a loading control. (B) The population doubling of U937 control-shRNA and U937 TrkC-shRNAs cells. Each data point represents the mean of cells counted in three dishes. (C) The population doubling of U937 cells with or without treatment of K252a. U937 cells were grown in 6-well plates and treated with K252a (100 nM) or vehicle control [dimethyl sulfoxide (DMSO)] for five days. Each data point represents the mean of cells counted in three dishes.
Fig. 3.
Fig. 3.
Loss of TrkC leads to loss of cell viability. (A) Cleavage of procaspase-3 and PARP of U937 control-shRNA or U937 TrkC-shRNA cells was analyzed by Western blotting. (B) Cell viability of U937 cells after treatment with K252a (100 nM) or vehicle control [dimethyl sulfoxide (DMSO)] was determined by MTT assay. Experiments were performed and the results shown reflect the mean and standard mean error (SEM) of each group. The experiments were repeated three times with similar results. *P < 0.0001 as determined by a Student’s t-test. (C) Cleavage of procaspase-3 and PARP of U937 cells with or without treatment with K252a was analyzed by Western blotting. (D) Representative FACS histograms indicating the percentage of apoptotic U937 cells after treatment with K252a as determined by binding of FITC-conjugated Annexin V. FACS analyses were conducted 24 h after culture. Right columns, mean number of Annexin V-positive cells expressed as a percentage of total cells. (E) Representative FACS histograms indicating the percentage of apoptotic U937 control-shRNA or U937 TrkC-shRNA cells as determined by binding of FITC-conjugated Annexin V. FACS analyses were conducted 24 h after culture. Right columns, mean number of Annexin V-positive cells expressed as a percentage of total cells.
Fig. 4.
Fig. 4.
TrkC regulates Akt activity and directly regulates its downstream target, mTOR. (A) The expression of phospho-Akt, phosphor-mTOR, and mTOR was examined in U937 control-shRNA or U937 TrkC-shRNA cells by immunoblotting. β-actin was used as a loading control. (B) The relative expression level of mRNAs encoding mTOR in U937 control-shRNA or U937 TrkC-shRNA cells, as determined by real-time PCR. The endogenous GAPDH mRNA level was measured as an internal control. (C) The expression of phospho-Akt, phosphor-mTOR, Akt, and mTOR of U937 cells with or without treatment with K252a. The U937 cells were grown and treated with K252a (100 nM) or vehicle control [dimethyl sulfoxide (DMSO)]. (D) The relative expression level of mRNAs encoding mTOR of U937 cells with or without treatment by K252a, as determined by real-time PCR. The endogenous GAPDH mRNA level was measured as an internal control.
Fig. 5.
Fig. 5.
TrkC induces leukemogenesis by upregulating PLK-1 and Twist-1 as downstream targets. (A) The relative expression levels of PLK-1, and Twist-1 was examined with immunoblotting and quantitative RT-PCR in U937 control-shRNA or U937 TrkC-shRNA cells. The data are reported as the mean ± SEM. **P < 0.05 as determined by the Student’s t-test. (B) The relative expression levels of PLK-1, and Twist-1 was examined with immunoblotting and quantitative RT-PCR in U937 cells after K252a treatment. The data are reported as the mean ± SEM. **P < 0.05 as determined by a Student’s t-test. (C) The relative expression levels of PLK-1, and Twist-1 was examined with immunoblotting and quantitative RT-PCR in U937 cells after LY294002 treatment. The data are reported as the mean ± SEM. **P < 0.05 as determined by a Student’s t-test.

References

    1. Chen-Tsai CP, Colome-Grimmer M, Wagner RF., Jr (2004). Correlations among neural cell adhesion molecule, nerve growth factor, and its receptors, TrkA, TrkB, TrkC, and p75, in perineural invasion by basal cell and cutaneous squamous cell carcinomas. Dermatol Surg. 30, 1009–1016 - PubMed
    1. Cheng GZ, Chan J, Wang Q, Zhang W, Sun CD, Wang LH. (2007). Twist transcriptionally up-regulates AKT2 in breast cancer cells leading to increased migration, invasion, and resistance to paclitaxel. Cancer Res. 67, 1979–1987 - PubMed
    1. Christiansen DH, Andersen MK, Desta F, Pedersen-Bjergaard J. (2005). Mutations of genes in the receptor tyrosine kinase (RTK)/RAS-BRAF signal transduction pathway in therapy-related myelodysplasia and acute myeloid leukemia. Leukemia 19, 2232–2240 - PubMed
    1. Cosset E, Hamdan G, Jeanpierre S, Voeltzel T, Sagorny K, Hayette S, Mahon FX, Dumontet C, Puisieux A, Nicolini FE, et al. (2011). Deregulation of TWIST-1 in the CD34+ compartment represents a novel prognostic factor in chronic myeloid leukemia. Blood 117, 1673–1676 - PubMed
    1. Dong F, Brynes RK, Tidow N, Welte K, Lowenberg B, Touw IP. (1995). Mutations in the gene for the granulocyte colony-stimulating-factor receptor in patients with acute myeloid leukemia preceded by severe congenital neutropenia. N Engl J Med. 333, 487–493 - PubMed

Publication types

MeSH terms