. 2013 Jul 23;110(30):12385-90.
doi: 10.1073/pnas.1216082110. Epub 2013 Jul 5.

Osteoclast precursors in murine bone marrow express CD27 and are impeded in osteoclast development by CD70 on activated immune cells

Affiliations

Osteoclast precursors in murine bone marrow express CD27 and are impeded in osteoclast development by CD70 on activated immune cells

Yanling Xiao et al. Proc Natl Acad Sci U S A. .

Abstract

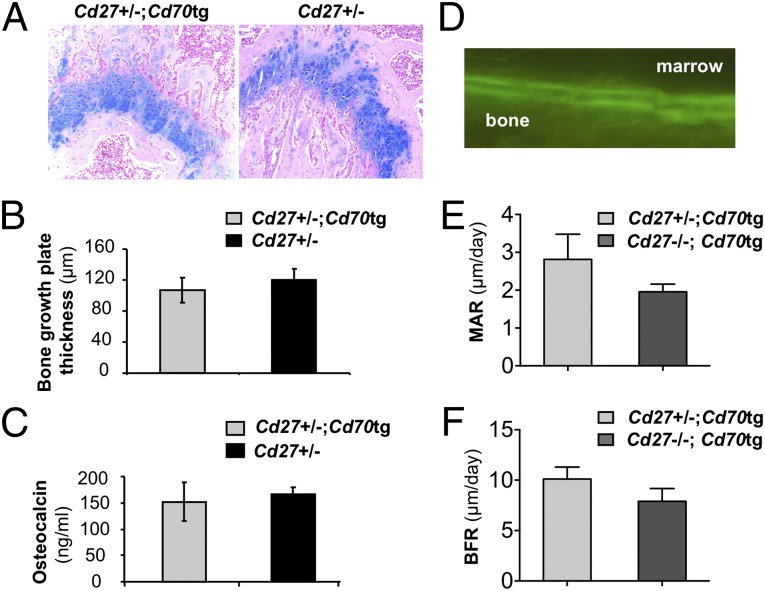
Osteoclasts (OCs) are bone-resorbing cells that are formed from hematopoietic precursors. OCs ordinarily maintain bone homeostasis, but they can also cause major pathology in autoimmune and inflammatory diseases. Under homeostatic conditions, receptor activator of nuclear factor kappa-B (RANK) ligand on osteoblasts drives OC differentiation by interaction with its receptor RANK on OC precursors. During chronic immune activation, RANK ligand on activated immune cells likewise drives pathogenic OC differentiation. We here report that the related TNF family member CD70 and its receptor CD27 can also mediate cross-talk between immune cells and OC precursors. We identified CD27 on a rare population (0.3%) of B220(-)c-Kit(+)CD115(+)CD11b(low) cells in the mouse bone marrow (BM) that are highly enriched for osteoclastogenic potential. We dissected this population into CD27(high) common precursors of OC, dendritic cells (DCs) and macrophages and CD27(low/neg) downstream precursors that could differentiate into OC and macrophages, but not DC. In a recombinant mouse model of chronic immune activation, sustained CD27/CD70 interactions caused an accumulation of OC precursors and a reduction in OC activity. These events were due to a CD27/CD70-dependent inhibition of OC differentiation from the OC precursors by BM-infiltrating, CD70(+)-activated immune cells. DC numbers in BM and spleen were increased, suggesting a skewing of the OC precursors toward DC differentiation. The impediment in OC differentiation culminated in a high trabecular bone mass pathology. Mice additionally presented anemia, leukopenia, and splenomegaly. Thus, under conditions of constitutive CD70 expression reflecting chronic immune activation, the CD27/CD70 system inhibits OC differentiation and favors DC differentiation.

Keywords: TNF receptor family; costimulation; hematopoiesis; osteoimmunology.


Conflict of interest statement

The authors declare no conflict of interest.

Figures

Fig. 1.
Fig. 1.
Cd27+/;Cd70tg mice have a high trabecular bone mass phenotype. (A) Macroscopic view of pale bone in Cd27+/−;Cd70tg mice, compared with Cd27−/−;Cd70tg and Cd27+/− control mice. (B) Stereomicroscopy of long bones from mice of the indicated genotypes. (C) Examples of histological analyses of long bones from mice of the indicated genotypes (age 10–12 wk). Oval denotes the affected area in Cd27+/−;Cd70tg mice. (Original magnification: 2.5×.) High magnifications of deeper sections of the same bones (10×) are shown in Fig. S1A. (D and E) Quantification of trabecular bone separation and thickness from histological data of male mice (age 8–10 wk; Cd27/;Cd70tg: n = 3; Cd27+/;Cd70tg: n = 5; Cd27+/ n = 4; *P < 0.05; **P < 0.01; ***P < 0.001). See Fig. S1 B and C for data on female mice and Fig. S1D for BV/TV. (F) Illustration of the high trabecular bone mass phenotype by μCT. Region between the two lines was used for BV/TV determination on total tibia, including trabecular and cortical bone. (G) Quantification of BV/TV (ratio) from μCT data in age-matched mice of the indicated genotypes (n = 3–4, *P < 0.05).
Fig. 2.
Fig. 2.
Bone forming activity appears normal in Cd27+/;Cd70tg mice. (A) Alcian blue-periodic acid Schiff histochemistry, identifying cartilage extracellular matrix within the growth plate of the femur. (Original magnification: 20×.) (B) Using ImageJ software, histochemistry data were quantified in Cd27+/;Cd70tg and Cd27+/ control mice (n = 5; age 10–12 wk). (C) Serum level of the bone formation marker osteocalcin, determined by ELISA in Cd27+/;Cd70tg mice and Cd27+/ control mice (n = 8; age 8–10 wk). (DF) Dynamic bone labeling with calcein of female Cd27+/;Cd70tg mice and control Cd27−/−;Cd70tg mice (n = 3–4; age 8 wk). Mice were injected at days 0 and 7 with 10 mg/kg calcein (Sigma) in PBS and killed at day 10. Longitudinal midfemur cryostat sections from snap frozen, gelatin-embedded bones were analyzed by microscopy. (D) Illustration of calcein incorporation into the femur shaft bone as detected by fluorescence microscopy. Dynamic bone parameters were assessed for half of the shaft. (E) Mineral apposition rate (MAR), determined by measuring the distance between the two fluorescent lines depicted in D at multiple sites in the shaft and calculating the mean. (F) Bone formation rate (BFR), i.e., MAR multiplied by the shaft fraction that was double labeled with calcein, based on half of the shaft length, measured from the epiphysis.
Fig. 3.
Fig. 3.
OC differentiation is reduced in Cd27+/;Cd70tg mice. (A) CTX-I levels, read out by ELISA in serum of Cd27+/;Cd70tg mice and Cd27+/ control mice (n = 5; age 12 wk). The experiment is representative of two. (B and C) RANK induction. Total BM of Cd27+/;Cd70tg mice and Cd27+/ control mice (n = 4) was cultured for 3 d with M-CSF and analyzed for presence of RANK+, CD11b+ cells. (B) Representative flow cytometric analysis. (C) Quantification of RANK+ cells within CD11b+ BM cells. (D and E) Total BM cells of 7- to 8-wk-old mice (n = 4) were cultured at 100,000 cells per well in duplicate with M-CSF and RANKL. At day 6, mature OCs were identified as tartrate-resistant acid phosphatase (TRAP)+ cells containing more than three nuclei. (D) Microscopic image of in vitro OC differentiation cultures showing TRAP and DAPI staining. Insets in Left indicate areas selected for digital zoom-ins presented in Right. (E) Quantitative analysis of OC differentiation. OCs are categorized in classes with 3–5, 6–10, and more than 10 nuclei (***P < 0.001). Data are representative of multiple independent experiments.
Fig. 4.
Fig. 4.
CD27 is expressed on B220c-Kit+CD115+CD11blow OCPs and separates them into common OC/DC precursors and more committed OCPs. (A, Left) Staining and gating strategy for flow cytometric identification of CD27 on B220c-Kit+CD115+CD11blow OCPs in the murine BM, and subdivision of this population into CD27high (G2) and CD27low (G1) subsets. Numbers indicate the percentage of cells within the gate. Fluorochromes used were CD27 PE, B220 PB, c-Kit PE-Cy7, CD115 APC, and CD11b PerCP-Cy5.5. (Right) Frequency of indicated OCPs in total BM. (B) OCPs (B220c-Kit+CD115+CD11blow) with a CD27high (G2) or CD27low (G1) phenotype were sorted from pooled BM cells of WT mice (n = 4), and 3,000 cells of each population were cultured under OC differentiation conditions. Triplicate cultures were quantified on day 5, (**P < 0.01). (C and D) Sorted CD27high and CD27low OCP subsets were cultured with (+) or without (−) M-CSF. After 36 h, CD27, RANK, and CD11b expression was determined by flow cytometry. (E and F) Sorted CD27high and CD27low OCP subsets were cultured with Flt3 ligand. At day 8, cells were stained for CD11c and B220 to identify conventional (c) DC and plasmacytoid (p) DC and analyzed by flow cytometry. (E) Quantification of total CD11c+ DCs generated from CD27high (G2) and CD27low (G1) OCP subsets. (F) Representative flow cytometric analysis of cells derived from the CD27high (G2) OCP subset, diagnosing cDCs, and pDCs. Data are representative of three independent experiments.
Fig. 5.
Fig. 5.
Sustained CD27–CD70 interactions result in accumulation of CD27low OCP in the BM that are arrested in their further development. (A) Flow cytometric analysis of CD27 expression levels on gated B220c-Kit+CD115+CD11blow OCPs as identified in BM of mice of the indicated genotypes. Fluorochromes used were CD27 FITC, B220 PB, c-Kit PE-Cy7, CD115 APC, and CD11b PerCP-Cy5.5. (B and C) Frequency (B) and absolute number (C) of total B220c-Kit+CD115+CD11blow OCPs in BM of mice of the indicated genotypes (n = 3–4; *P < 0.05; **P < 0.01). Data are representative of three independent experiments. (DF) Side-by-side OC differentiation cultures of bulk BM cells and sorted OCPs. Bulk BM cells from mice of the indicated genotypes (n = 4, age 5 wk) were seeded at 100,000 cells per well. The same batches of BM cells were pooled (n = 4) per genotype for OCP sorting, and purified OCPs were seeded at 3,000 cells per well. Cultures were performed in quadruplicate and read out at day 6. (D) Representative images obtained by combined light and fluorescence microscopic examination of OC culture results at day 6. Green color represents DAPI staining of nuclei. (Original magnification: 5×.) (E and F) Quantification of OC numbers at day 6 after plating under OC culture conditions of bulk BM cells (E) or purified OCPs (F) (***P < 0.001). Data are representative of two independent experiments.
Fig. 6.
Fig. 6.
Constitutive CD27 engagement by CD70-bearing cells in the BM limits OC formation. (A) Frequency of B cells (B220+), T cells (CD3+), myeloid cells (CD11b+), and DCs (CD11c+) cells within total BM cells in mice of the indicated genotypes (n = 3, age 7–8 wk, **P < 0.01; ***P < 0.001 compared with Cd27+/− mice). (B) Representative flow cytometric analysis of CD70 expression on the indicated cell populations in the BM of mice of the indicated genotypes, diagnosed as in A. Data in A and B are representative of three independent experiments. (C) Numbers of OCs generated from total BM cells of mice of indicated genotypes at day 6 after plating under OC differentiation conditions with (+) or without (−) anti-CD70 mAb FR70 (5 μg/mL). Each bar represents mean ± SEM of four to five mice, with triplicate samples for each mouse (***P < 0.001). (D) Numbers of OCs formed from total BM cells of Cd27+/−;Cd70tg mice (control) or the same cells that were flow cytometrically depleted for B cells (B220+), T cells (CD3+), myeloid cells (CD11bhigh), or DCs (CD11c+) (n = 3; ***P < 0.001). Number of cells seeded were corrected for percentage of cells depleted. Data in C and D are representative of two independent experiments. (E and F) Absolute number of DCs in BM and spleen of mice of the indicated genotypes (n = 3–4, age 7–8 wk; *P < 0.05; **P < 0.01).

Similar articles

Cited by

References

    1. Pittenger MF, et al. Multilineage potential of adult human mesenchymal stem cells. Science. 1999;284(5411):143–147. - PubMed
    1. Arai F, et al. Commitment and differentiation of osteoclast precursor cells by the sequential expression of c-Fms and receptor activator of nuclear factor kappaB (RANK) receptors. J Exp Med. 1999;190(12):1741–1754. - PMC - PubMed
    1. Quinn JM, Elliott J, Gillespie MT, Martin TJ. A combination of osteoclast differentiation factor and macrophage-colony stimulating factor is sufficient for both human and mouse osteoclast formation in vitro. Endocrinology. 1998;139(10):4424–4427. - PubMed
    1. Lacey DL, et al. Osteoprotegerin ligand is a cytokine that regulates osteoclast differentiation and activation. Cell. 1998;93(2):165–176. - PubMed
    1. Kong YY, et al. OPGL is a key regulator of osteoclastogenesis, lymphocyte development and lymph-node organogenesis. Nature. 1999;397(6717):315–323. - PubMed

Substances

LinkOut - more resources