. 2013 Oct;24(10):1599-616.
doi: 10.1681/ASN.2013010030. Epub 2013 Jul 5.

Plasticity of renal erythropoietin-producing cells governs fibrosis

Affiliations

Plasticity of renal erythropoietin-producing cells governs fibrosis

Tomokazu Souma et al. J Am Soc Nephrol. 2013 Oct.

Abstract

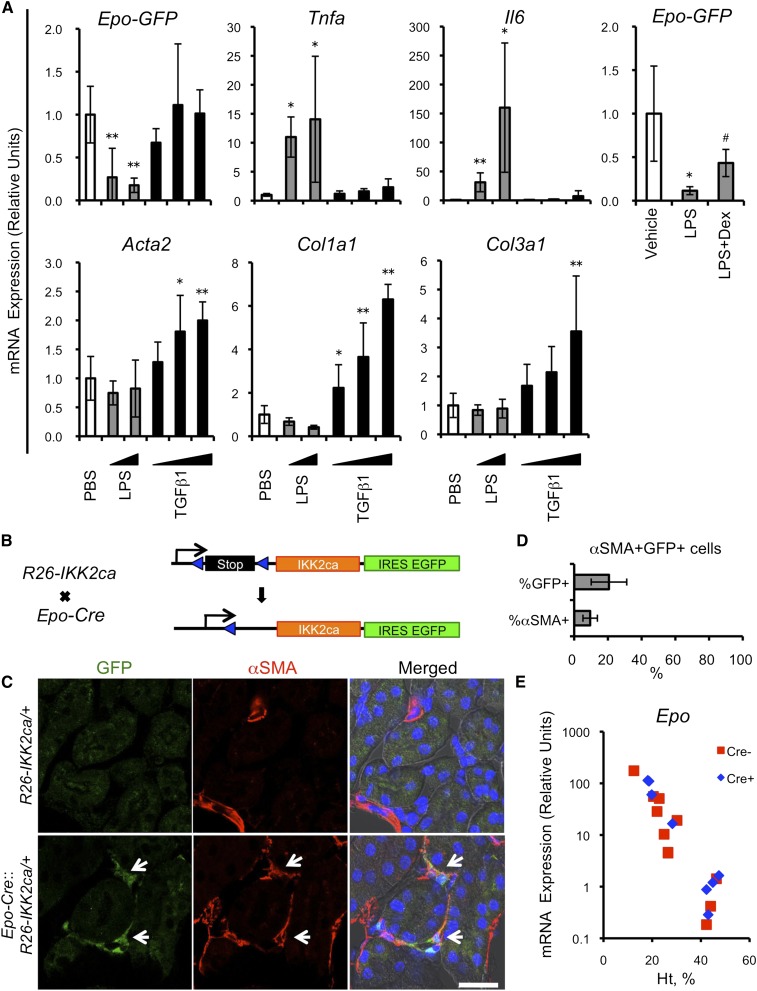
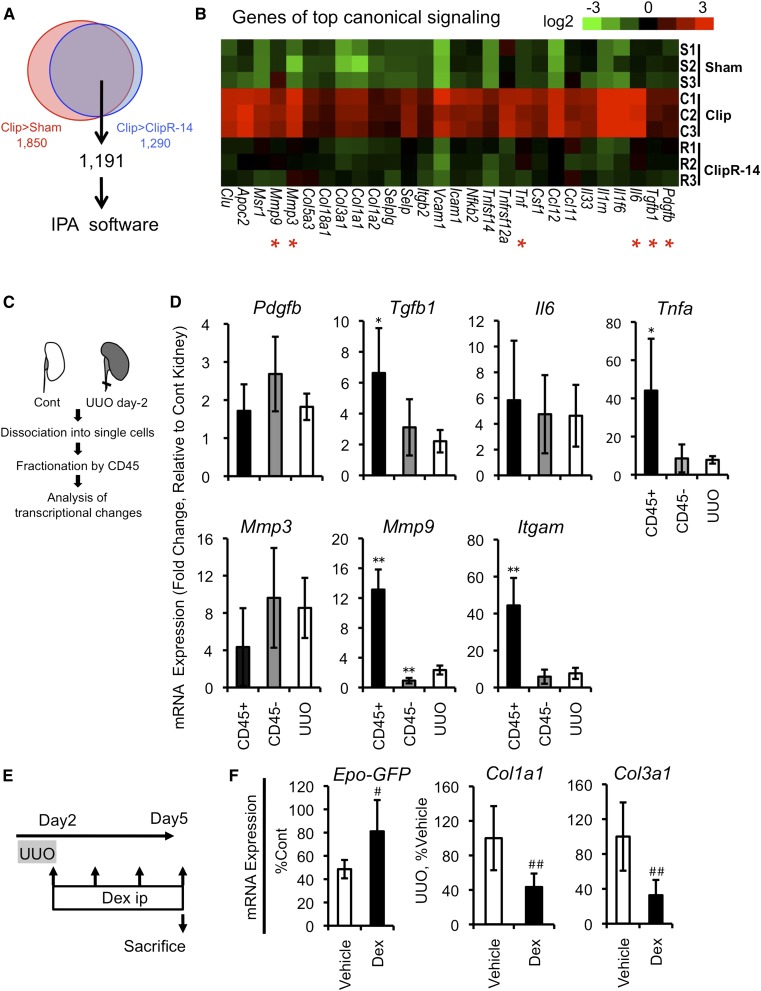
CKD progresses with fibrosis and erythropoietin (Epo)-dependent anemia, leading to increased cardiovascular complications, but the mechanisms linking Epo-dependent anemia and fibrosis remain unclear. Here, we show that the cellular phenotype of renal Epo-producing cells (REPs) alternates between a physiologic Epo-producing state and a pathologic fibrogenic state in response to microenvironmental signals. In a novel mouse model, unilateral ureteral obstruction-induced inflammatory milieu activated NFκB and Smad signaling pathways in REPs, rapidly repressed the Epo-producing potential of REPs, and led to myofibroblast transformation of these cells. Moreover, we developed a unique Cre-based cell-fate tracing method that marked current and/or previous Epo-producing cells and revealed that the majority of myofibroblasts are derived from REPs. Genetic induction of NFκB activity selectively in REPs resulted in myofibroblastic transformation, indicating that NFκB signaling elicits a phenotypic switch. Reversing the unilateral ureteral obstruction-induced inflammatory microenvironment restored the Epo-producing potential and the physiologic phenotype of REPs. This phenotypic reversion was accelerated by anti-inflammatory therapy. These findings demonstrate that REPs possess cellular plasticity, and suggest that the phenotypic transition of REPs to myofibroblasts, modulated by inflammatory molecules, underlies the connection between anemia and renal fibrosis in CKD.


Figures

Figure 1.
Figure 1.
UUO leads to rapid loss of REP potential. (A) Schematic presentation of ISAM generation. (B) Distribution patterns of G-REPs under anemic (Ht 17%) and normal (Ht 42%) conditions. In the latter case, ISAM are treated with rHuEPO. The inset shows a higher magnification of G-REPs. (C) Epo-GFP mRNA levels after administration of rHuEPO or PBS (n=4 per group). (D) UUO-induced expression changes of Epo-GFP and αSMA in ISAM kidneys. Immunofluorescence is performed for Epo-GFP (green) and αSMA (red) expressions, showing inverse expression patterns of these proteins. EM staining shows the fibrotic area as blue. (E–H) UUO-induced expression changes of Epo-GFP, Acta2, Tgfb1, and Tnfa. Real-time PCR analyses of Epo-GFP, Acta2 (encoding αSMA), Tgfb1 (encoding TGFβ1), and Tnfa (encoding TNFα) are performed using UUO-treated and control ISAM kidneys (n>4 per group). Epo-GFP mRNA level is expressed as the relative expression compared with the contralateral kidney. Data of the sham-treated group are used as the starting point (0 day), and are set as 100% (Epo-GFP mRNA) or 1 (the other mRNAs). *P<0.05; **P<0.01. Scale bars, 20 μm (inset) and 200 μm (right) in B; 100 μm in D. Cont, contralateral; EM, Elastica-Masson.
Figure 2.
Figure 2.
REPs are the major reservoir of myofibroblasts. (A) Expression of Epo-GFP and αSMA in early stages of UUO-treated ISAM kidneys. Immunofluorescence of Epo-GFP (green) and αSMA (red) is performed along with nuclear staining with DAPI (blue) using UUO-treated kidneys in early stages (day 1 to day 3). Note the overlapping expression of Epo-GFP and αSMA from day 2 after UUO. (B) Quantification of cells expressing both αSMA and Epo-GFP. Numbers of αSMA-positive G-REPs are compared with either those of total G-REPs (upper panel) or those of total αSMA-positive cells (lower panel) in five independent fields. **P<0.01 (n=3 per group). (C) Schematic presentation of the strategy for cell-fate analysis of REPs. A 180-kb BAC clone containing the Epo gene is used to generate an Epo-Cre mouse line. Crossing of the Epo-Cre mice with Rosa26-tdTomato (R26T) reporter mice generates Epo-Cre::R26T mice. (D) Cell-fate analysis of REPs in later stage of UUO kidneys. Native fluorescence of tdTomato (red; Epo-Cre cells) and immunofluorescence of αSMA (green) overlaps in UUO-treated kidneys at day 14, but not in sham-treated kidneys. (E) Distribution pattern of Epo-GFP and tdTomato in ISAM::Epo-Cre::R26T. Expressions of native Epo-GFP (green) and tdTomato (red) are analyzed using kidneys that underwent UUO or sham procedures (day 14). Note that tdTomato fluorescence, which represents previous and/or current expression of the Epo gene, is widely distributed in the UUO-treated kidney, but GFP fluorescence is diminished at this time point. (F) Myofibroblast transformation of Epo-Cre cells. Immunofluorescence for αSMA and tdTomato is performed using UUO kidneys at day 14. (G) Quantification of cells expressing both αSMA and tdTomato. Number of αSMA-positive Epo-Cre cells is compared with either those of total Epo-Cre cells or those of total αSMA-positive cells. (n=4). DAPI, 4',6-diamidino-2-phenylindole. Scale bars, 100 μm.
Figure 3.
Figure 3.
REPs contribute to renal fibrosis and inflammation. (A and B) TGFβ and NFκB signaling in G-REPs of UUO-treated ISAM kidney. Immunofluorescence of Epo-GFP (green), p-Smad2/3 or p-p65 (red), and nucleus (blue) is performed using UUO-treated kidneys at day 1 after UUO. White arrows indicate cells that show nuclear accumulation of p-p65 or p-Smad2/3 in G-REPs. (C) Schematic presentation of the FACS protocol for isolation of G-REPs from UUO-treated (day 2) and normal ISAM kidneys. (D) Appearance of FACS-isolated G-REPs. Immunofluorescence of FACS-isolated G-REPs is performed for Epo-GFP (green) and αSMA (red), and nucleus was stained by DAPI (blue). (E) Transcriptional profiles in G-REPs upon UUO. Real-time PCR analyses are performed with FACS-isolated G-REPs to quantify Epo-GFP, Hif1a (HIF-1α), Hif2a (HIF-2α), Arnt (HIF-1β), Acta2, Col1a1 (type I collagen α1), Col3a1 (type III collagen α1), Serpine1 (plasminogen activator inhibitor 1), Rela (p65), Ccl2 (MCP1), Il6 (IL6), and Map2 (MAP2); names in parentheses indicate encoded proteins. *P<0.05; **P<0.01 (n=3, per group; one sample comprises 100,000 G-REPs collected from 5–10 mice). Scale bars, 20 μm in B.
Figure 4.
Figure 4.
Essential contribution of NFκB signaling for the dysfunction of REPs. (A) Pharmacologic activations of NFκB and Smad signals in ISAM. Real-time PCR analyses are performed using ISAM kidneys 6 hours after single intraperitoneal injection of LPS, TGFβ1, or PBS. For antagonizing NFκB signaling, dexamethasone is administered simultaneously with LPS (LPS+Dex). *P<0.05 and **P<0.01 versus PBS-injected group; #P<0.05 versus LPS-injected group (n>3 per group). (B) Schematic presentation of the strategy to selectively activate NFκB signaling in REPs. Epo-Cre mice are crossed with R26-IKK2ca mice. Expression of EGFP from the IRES cassette allows the identification of Epo-Cre cells, and indicates recombination of the R26-IKK2ca locus. (C) NFκB signals as a phenotypic switch in REPs. Immunofluorescence is performed for EGFP (green) and αSMA (red), and nucleus is stained by DAPI (blue) using kidneys from Epo-Cre::R26-IKK2ca/+ mice. White arrows indicate αSMA-positive Epo-Cre cells, indicating myofibroblastic transformation. (D) Quantification of cells expressing GFP and αSMA. The number of αSMA-positive Epo-Cre cells (GFP-positive cells) is compared with either that of total Epo-Cre cells or total αSMA-positive cells (n=4). (E) Epo mRNA expression of Epo-Cre::R26-IKK2ca/+ mice. Real-time PCR analyses are performed for quantifying Epo mRNA levels using whole kidneys. EGFP, enhanced GFP; IRES, internal ribosome entry site; Dex, dexamethasone. Scale bar, 20 μm in C.
Figure 5.
Figure 5.
Elimination of UUO stress restores the normal Epo-producing potential. (A) Representative photographs of the UUO reversal model using vascular clips (Clip-ClipR treatment). We obstruct the left ureter by a vascular clip for 2 days (Clip). The vascular clip is removed 2 days after the obstruction, and then mice are euthanized 12 days after the removal (ClipR-14). (B) Recovery of Epo-producing potential of G-REPs in UUO-treated kidneys after the clip removal. Real-time PCR analysis is performed to quantify Epo-GFP mRNA levels, which are expressed as the relative expression compared with the contralateral (Cont) kidney. **P<0.01 versus sham and ClipR-14 (n=5 per group). (C) Changes of fibrogenic markers during Clip-ClipR treatment. Real-time PCR analyses are performed to quantify Acta2, Col1a1, and Col3a1 mRNA expressions using kidneys of sham, Clip, and ClipR-14 groups. ***P<0.01 versus sham and contralateral kidneys (n=5 per group). (D) Schematic presentation for the cell-fate analyses of REPs upon Clip-ClipR treatment. (E) Distribution of ON-REPs (Epo-GFP+ cells) and total REPs (tdTomato+ cells) upon Clip-ClipR treatment. Immunohistochemical analysis performed for Epo-GFP and tdTomato using kidneys of ISAM::Epo-Cre::R26T. (F and G) Changes in cell number of ON-REPs and total REPs upon Clip-ClipR treatment. FACS analyses are performed to count the number of Epo-GFP+ cells and tdTomato+ cells in ClipR-14 kidneys and contralateral (Cont) kidneys (n=5). Cont, contralateral; IHC, immunohistochemical analysis; NS, not significant. Scale bar in E, 200 μm.
Figure 6.
Figure 6.
REPs possess cellular plasticity that responds to environmental signals. (A) Morphologic changes of G-REPs upon Clip-ClipR treatment determined by immunoelectron microscopic analyses. Uninjured G-REPs appear as osmium-positive (black) cells that adhere to proximal tubular cells and capillaries (sham). In contrast, UUO alters the morphology of G-REPs to show characteristic myofibroblastic features (Clip). The morphologic features of G-REPs regain normal features 12 days after the clip release (ClipR-14). Green arrows and red arrowheads indicate G-REPs and their processes, respectively. Lower panels are higher magnification of dotted boxes in upper panels. (B) Schematic presentation for the cell-fate analyses of G-REPs. Cell-fate of G-REPs is tracked by pulse labeling using single injection of BrdU, and then mice are euthanized at day 7 (ClipR-7) and day 14 (ClipR-14). (C) BrdU incorporation into G-REPs upon Clip-ClipR treatment. Immunofluorescence of Epo-GFP (green) and BrdU (red) are performed, and nucleus is stained with DAPI (blue) using kidneys treated as depicted in B. Right panels are higher magnifications of dotted boxes in left panels. (D) Efficacy of the cell tracking using BrdU incorporation. The BrdU-incorporated G-REPs are counted in five independent fields (n≥3 per group). Approximately 7%–15% (yellow) of total G-REPs (green and yellow) are labeled with BrdU after UUO. Some tubular and GFP-negative interstitial cells also incorporate BrdU (red). PT, proximal tubular cell; C, capillary; DAPI, 4',6-diamidino-2-phenylindole. Scale bars, 10 μm (upper panels) and 0.1 μm (lower panels) in A; 20 μm in C.
Figure 7.
Figure 7.
DNMTs are increased in myofibroblast-transformed REPs. (A) UUO-induced expression changes of DNMTs. Real-time PCR analyses of Dnmt1, Dnmt3a, and Dnmt3b are performed using UUO-treated and control ISAM kidneys (n≥3 per group). Data of the sham-treated group are used as the starting point (0 day), and set as 1. *P<0.05 and **P<0.01 versus sham. (B) Transcriptional profiles of DNMTs in G-REPs upon UUO. Real-time PCR analyses are performed with FACS-isolated G-REPs to quantify Dnmt1, Dnmt3a, and Dnmt3b. #P<0.05 and ##P<0.01 (n=3 per group; see Figure 3, C and D, for details). (C) Recovery of expression profiles of DNMTs after the clip removal. Real-time PCR analyses are performed to quantify Dnmt1, Dnmt3a, and Dnmt3b. P<0.05 and ††P<0.01 versus sham and ClipR-14 (n=5 per group). Cont, contralateral.
Figure 8.
Figure 8.
Phenotypic reversions of damaged REPs are accelerated by anti-inflammatory therapy. (A) A Venn diagram summarizing the differential expression of transcripts in the kidneys with Clip-ClipR treatment. The sum of 1191 differentially regulated transcripts is identified by the microarray analyses using kidneys of sham, Clip, and ClipR-14 groups (n=3 per group, per array). (B) Top signaling pathway responsible for the myofibroblastic transformation of REPs. IPA reveals that the atherosclerosis signaling is the most significant canonical signaling pathway and a heat-map representation of genes involved in this pathway is shown. Genes marked with red asterisks are examined in D. (C) Schematic presentation of cell isolation method from UUO-treated kidneys. Infiltrating and resident leukocytes are collected from single-cell suspensions of kidneys by using anti-CD45 antibody at UUO day 2. Fractionated cells were subjected for real-time PCR analyses. (D) Infiltrated leukocytes and residual renal cells collaboratively create inflammatory microenvironments. Real-time PCR analyses are performed to quantify mRNA expression levels for Pdgfb (encoding PDGFβ), Tgfb1, Il6, Tnfa, Mmp3 (encoding matrix metalloproteinase 3), Mmp9, and Itgam (also known as CD11b, a surface marker for monocyte/macrophage). Relative mRNA levels in CD45+ fraction, CD45 fraction, and whole UUO kidneys are expressed as fold changes compared with those of contralateral kidneys (set as 1). *P<0.05 and **P<0.01 versus UUO-treated kidneys (n=5 per group). (E) Schematic presentation of dexamethasone treatment. Dex is injected daily after the clip removal for 4 days, and mice are then euthanized for the subsequent analyses. (F) Effects of dexamethasone on the recovery of G-REPs. Real-time PCR analyses are performed for quantifying mRNA levels of Epo-GFP, Col1a1, and Col3a1 using vehicle-treated and dexamethasone-treated ISAM kidneys. Epo-GFP level is expressed as the relative expression compared with the contralateral kidney. #P<0.05 and ##P<0.01 (n≥3 per group). Cont, contralateral; Dex, dexamethasone.
Figure 9.
Figure 9.
REPs show the dynamic phenotypic changes in health and disease. In healthy conditions, most REPs are in “OFF” state and do not produce Epo. In response to anemic and/or hypoxic stimuli, REPs turn to “ON” state and start to produce Epo. In injured kidneys, microinflammation and other stresses transform REPs into myofibroblasts, possibly due to the NFκB and Smad signals. Myofibroblast-transformed REPs lose Epo-producing potential and actively contribute to renal fibrosis and inflammation. By eliminating the inflammatory signals, myofibroblast-transformed REPs restart producing Epo, regaining their physiologic phenotypes. Persisting inflammatory signals augment expression levels of DNMTs in myofibroblast-transformed REPs and might change their epigenetic codes (“epigenetic hits”). Modulation of inflammatory signals halts the inflammatory cycles and negates the deleterious link between fibrosis and anemia. We speculate that drugs targeting epigenetic modification would be an adjunct therapeutic strategy to bring back irreversibly transformed REPs to physiologic states. In summary, REPs possess profound cellular and functional plasticity in response to microenvironmental changes. Regulating the cellular status of REPs is important for treating renal fibrosis and anemia.

Comment in

References

    1. Maxwell PH, Osmond MK, Pugh CW, Heryet A, Nicholls LG, Tan CC, Doe BG, Ferguson DJP, Johnson MH, Ratcliffe PJ: Identification of the renal erythropoietin-producing cells using transgenic mice. Kidney Int 44: 1149–1162, 1993 - PubMed
    1. Obara N, Suzuki N, Kim K, Nagasawa T, Imagawa S, Yamamoto M: Repression via the GATA box is essential for tissue-specific erythropoietin gene expression. Blood 111: 5223–5232, 2008 - PubMed
    1. Wenger RH, Hoogewijs D: Regulated oxygen sensing by protein hydroxylation in renal erythropoietin-producing cells. Am J Physiol Renal Physiol 298: F1287–F1296, 2010 - PubMed
    1. Haase VH: Hypoxic regulation of erythropoiesis and iron metabolism. Am J Physiol Renal Physiol 299: F1–F13, 2010 - PMC - PubMed
    1. Eckardt KU, Koury ST, Tan CC, Schuster SJ, Kaissling B, Ratcliffe PJ, Kurtz A: Distribution of erythropoietin producing cells in rat kidneys during hypoxic hypoxia. Kidney Int 43: 815–823, 1993 - PubMed

Publication types

MeSH terms