. 2013 Jun;5(6):1968-1972.
doi: 10.3892/ol.2013.1292. Epub 2013 Apr 5.

1'-Acetoxychavicol acetate promotes caspase 3-activated glioblastoma cell death by overcoming enhanced cytokine expression

Affiliations

1'-Acetoxychavicol acetate promotes caspase 3-activated glioblastoma cell death by overcoming enhanced cytokine expression

Musa Williams et al. Oncol Lett. 2013 Jun.

Abstract

The brain consumes ∼20% of the oxygen utilized in the human body, meaning that brain tumors are vulnerable to paradoxical physiological effects from free radical generation. In the present study, 1'-acetoxychavicol acetate (ACA), a naturally derived antioxidant that inhibits xanthine oxidase, was evaluated for its role as an anti-tumorigenic agent in glioblastomas. The study revealed that ACA inhibited glioblastoma cell proliferation as a consequence of promoting apoptotic cell death by enhancing caspase 3 activity. It was also shown that ACA impaired the migratory ability of glioblastoma cells by decreasing their adhesive properties. Additionally, ACA increased the protein expression levels of the pro-survival signaling cytokines, IL-6 and IL-1α, established cell protectors and survival molecules in brain tumors. Together, these results demonstrate that, despite enhanced expression of compensatory signaling molecules that contribute to tumor cell survival, ACA is an effective pro-apoptotic inducing agent in glioblastomas.

Keywords: acetoxychavichol acetate; caspase 3; cytokines; glioblastomas.


Figures

Figure 1
Figure 1
Dose response of ACA on glio blastoma cells. Glioblastoma cell proliferation decreased in response to increasing concentrations of ACA. Solid black bars, vehicle-treated (DMSO) control cells; white bars, 10 μM ACA; hatched bars, 5 μM ACA; gray bars, 2 μM ACA. Data shown are representative of 3 independent experiments (means ± SE) performed in duplicate showing similar results. Abs, absorbance; ACA, 1′-acetoxychavicol acetate.
Figure 2
Figure 2
Clonogenic survival of glioblastoma cells treated with ACA. ACA inhibited the clonogenic survival of glioblastoma cells. Black bars, vehicle (DMSO)-treated control cells; white bars, U373, U87 and A172 cells treated with 1 μM ACA. Data shown are representative of at least 3 independent experiments performed in duplicate (means ± SE) with comparable results *P<0.05 compared to vehicle-treated control cells. ACA, 1′-acetoxychavicol acetate.
Figure 3
Figure 3
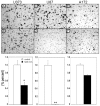
Motility of glioblastoma cells treated with the antioxidant ACA. (A–F) Motility was determined using polycarbonate membrane inserts. (A, C and E) Vehicle (DMSO)-treated control cells. (B, D and F) U373, U87, and A172 cells treated with 5 μM ACA. The antioxidant ACA impairs glioblastoma cell motility. The experiment shown is representative of 3 independent experiments performed in duplicate (means ± SE) that displayed similar results (*P<0.05, **P<0.01). ACA, 1′-acetoxychavicol acetate.
Figure 4
Figure 4
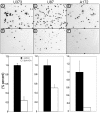
ACA impairs adhesive properties of glioblastomas. (A, C and E) Vehicle (DMSO)-treated control cells; (B, D and F) U373, U87 and A172 cells treated with 5 μM ACA. The experiment shown is representative of 3 independent experiments performed in duplicate (mean ± SE) that displayed similar results. ACA, 1′-acetoxychavicol acetate.
Figure 5
Figure 5
Assessment of caspase 3 activity in U87 and A172 glioblastoma cells in response to 2 μM ACA. Caspase 3 protein activity was measured 24 h post-exposure to ACA (white bars, vehicle control; black bars, ACA). Caspase 3 activity was enhanced in U87 and A172 glioblastoma cells in response to 2 μM ACA. Data is displayed as the mean ± SE of 3 separate independent experiments. ACA, 1′-acetoxychavicol acetate.
Figure 6
Figure 6
Evaluation of ROS levels as determined by measuring H2O2 concentration in U87 and A172 cells treated with 5 μM ACA. ACA had no effect on ROS levels. ♦, H2O2 standard serial dilution; ○, vehicle control treated cells; Δ, cell treated with 5 μM ACA. Abs, absorbance; ROS, reactive oxygen species; ACA, 1′-acetoxychavicol acetate.
Figure 7
Figure 7
Cytokine array analysis. Induction of cytokine expression (IL-6 and IL-1α) by ACA. (1) Cytokine antigen standard; (2) U87 vehicle-treated control cells; (3) U87 cells treated with 2 μM ACA; (4) A172 vehicle-treated control cells; (5) A172 cells treated with 2μM ACA. Experiment shown is representative of 3 independent experiments performed in duplicate that displayed similar results. ACA, acetoxychavicol acetate.

References

    1. Valko M, Rhodes CJ, Moncol J, Izakovic M, Mazur M. Free radicals, metals and antioxidants in oxidative stress-induced cancer. Chem Biol Interact. 2006;160:1–40. - PubMed
    1. Wang J, Yi J. Cancer cell killing via ROS: to increase or decrease, that is the question. Cancer Biol Ther. 2008;7:1875–1884. - PubMed
    1. Acharya A, Das I, Chandhok D, Saha T. Redox regulation in cancer: a double-edged sword with therapeutic potential. Oxid Med Cell Longev. 2010;3:23–34. - PMC - PubMed
    1. Cabello CM, Bair WB, III, Wondrak GT. Experimental therapeutics: targeting the redox Achilles heel of cancer. Curr Opin Investig Drugs. 2007;8:1022–1037. - PubMed
    1. Fang J, Seki T, Maeda H. Therapeutic strategies by modulating oxygen stress in cancer and inflammation. Adv Drug Deliv Rev. 2009;61:290–302. - PubMed

LinkOut - more resources