

Patterns of β-cell autoantibody appearance and genetic associations during the first years of life
- PMID: 23835325
- PMCID: PMC3781470
- DOI: 10.2337/db13-0300
Patterns of β-cell autoantibody appearance and genetic associations during the first years of life
Abstract
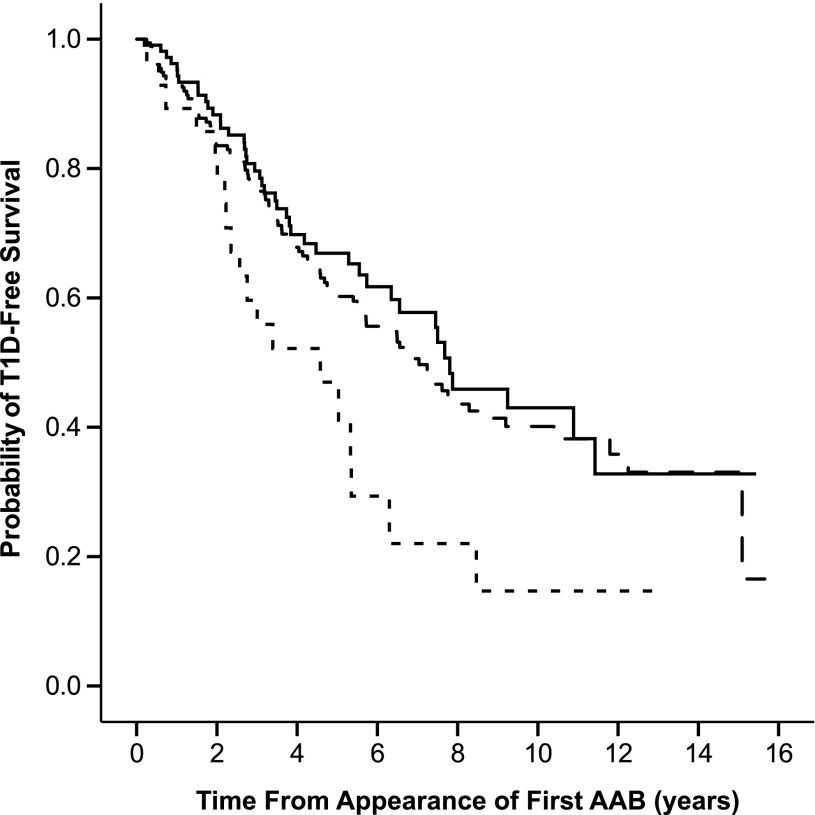
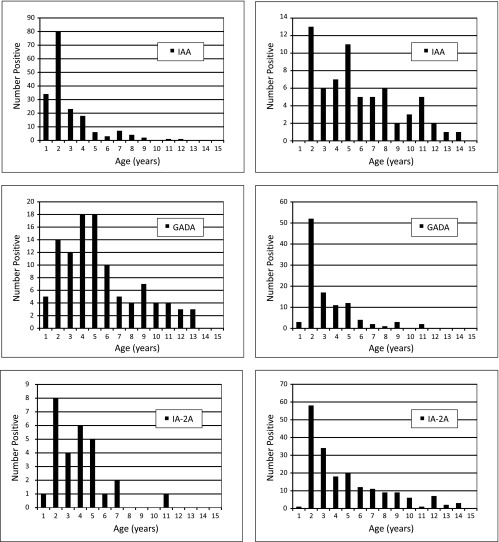
We analyzed demographic and genetic differences between children with various diabetes-associated autoantibodies reflecting the autoimmune process. In a prospective birth cohort comprising children with HLA-conferred susceptibility to type 1 diabetes (T1D), the pattern of autoantibody appearance was analyzed in 520 children with advanced β-cell autoimmunity associated with high risk for disease. In 315 cases, a single biochemical autoantibody could be identified in the first positive sample as insulin (insulin autoantibody [IAA]) in 180, as GAD (GAD antibody [GADA]) in 107, and as IA-2 antigen (IA-2 antibody [IA-2A]) in 28. The age at seroconversion differed significantly between the three groups (P = 0.003). IAA as the first autoantibody showed a peak time of appearance during the second year of life, whereas GADA as the first autoantibody peaked later, between 3 and 5 years of age. The risk-associated insulin gene rs689 A/A genotypes were more frequent in children with IAA as the first autoantibody compared with the other children (P = 0.002). The primary autoantigen in the development of β-cell autoimmunity and T1D seems to strongly correlate with age and genetic factors, indicating heterogeneity in the initiation of the disease process.
Figures
References
-
- Ziegler AG, Standl E, Albert E, Mehnert H. HLA-associated insulin autoantibody formation in newly diagnosed type I diabetic patients. Diabetes 1991;40:1146–1149 - PubMed
-
- Sabbah E, Savola K, Ebeling T, et al. Genetic, autoimmune, and clinical characteristics of childhood- and adult-onset type 1 diabetes. Diabetes Care 2000;23:1326–1332 - PubMed
-
- Vandewalle CL, Falorni A, Lernmark A, et al. Associations of GAD65- and IA-2- autoantibodies with genetic risk markers in new-onset IDDM patients and their siblings. The Belgian Diabetes Registry. Diabetes Care 1997;20:1547–1552 - PubMed
Publication types
MeSH terms
Substances
LinkOut - more resources
Full Text Sources
Other Literature Sources
Medical
Research Materials
