. 2013 Oct;62(10):3350-61.
doi: 10.2337/db13-0500. Epub 2013 Jul 8.

Skeletal muscle triacylglycerol hydrolysis does not influence metabolic complications of obesity

Affiliations

Skeletal muscle triacylglycerol hydrolysis does not influence metabolic complications of obesity

Mitch T Sitnick et al. Diabetes. 2013 Oct.

Abstract

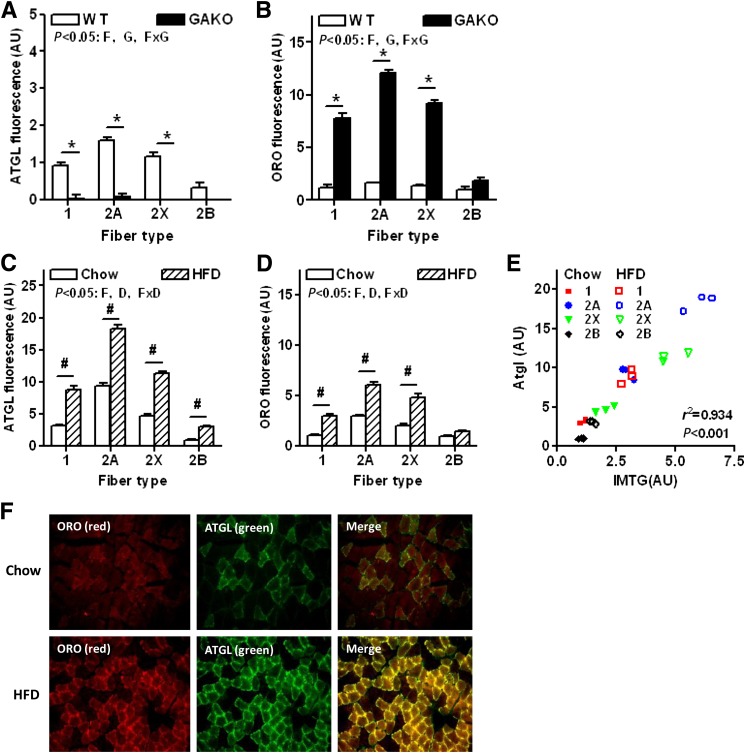
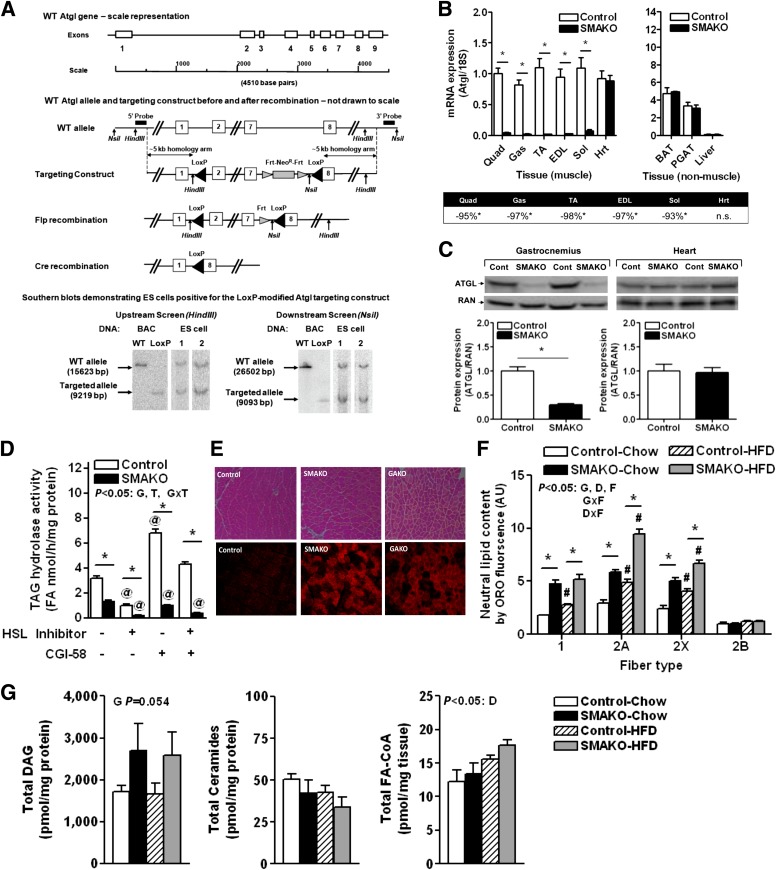
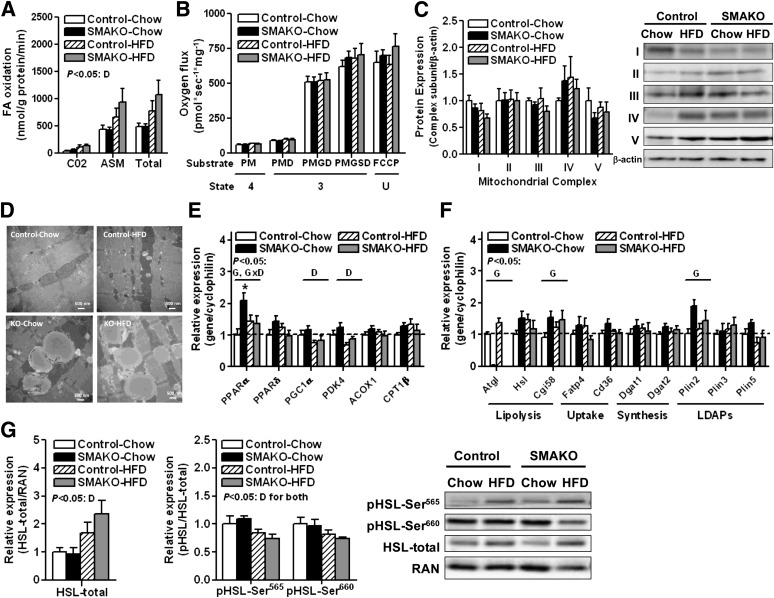
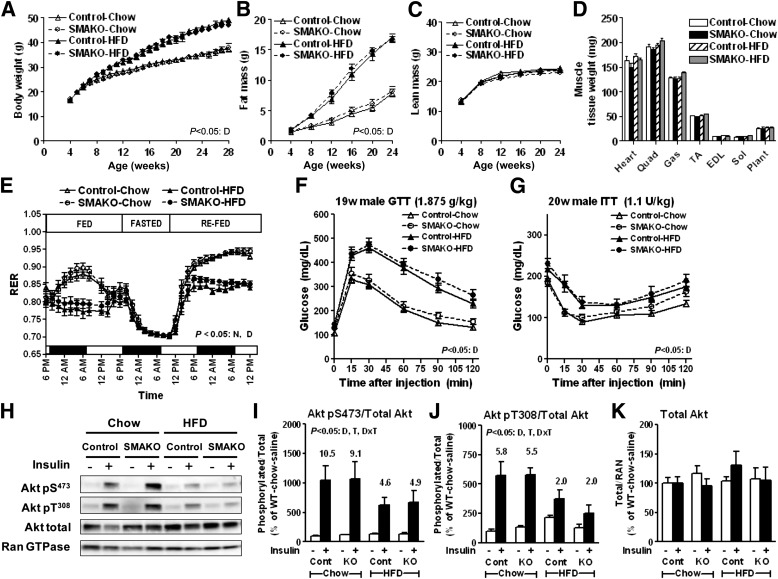
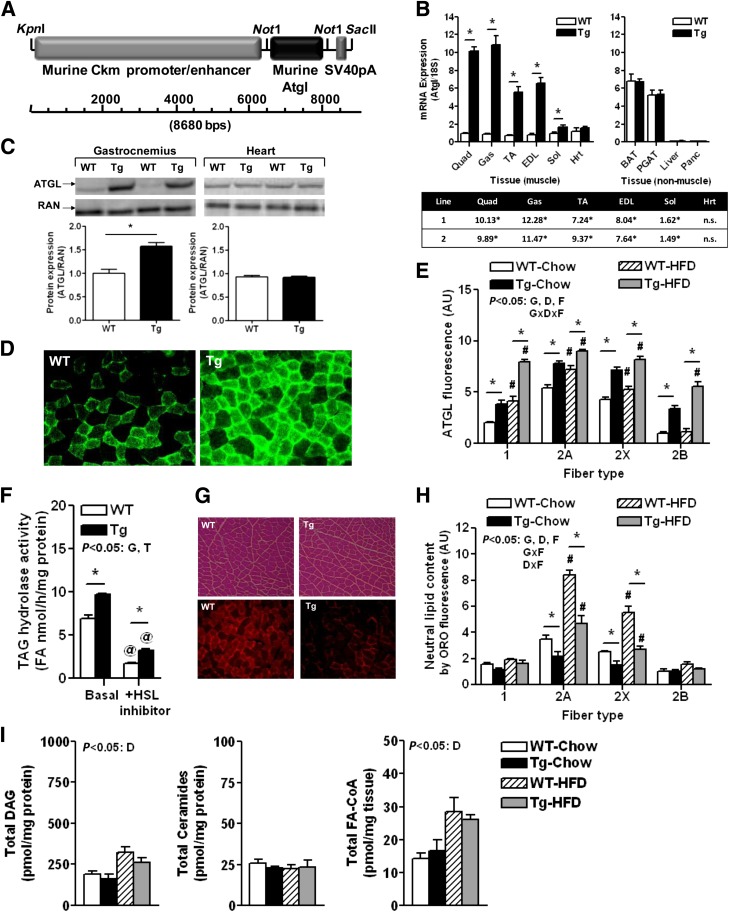
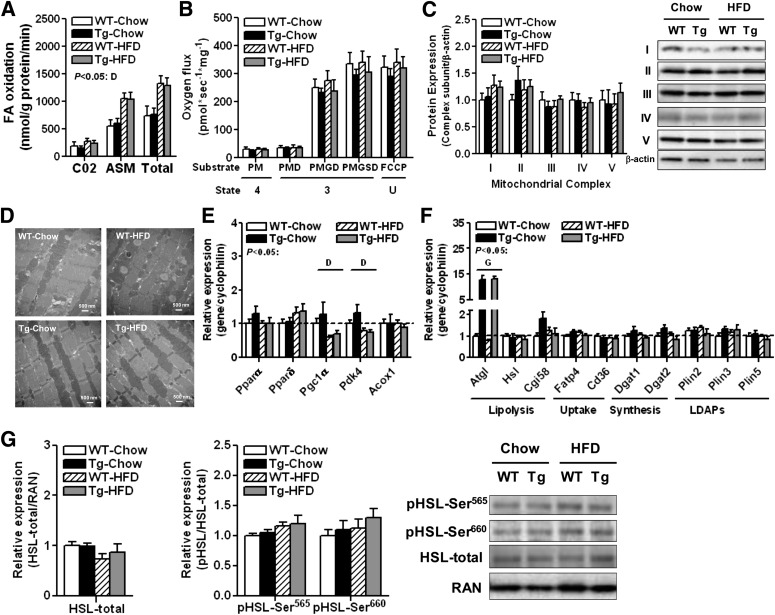
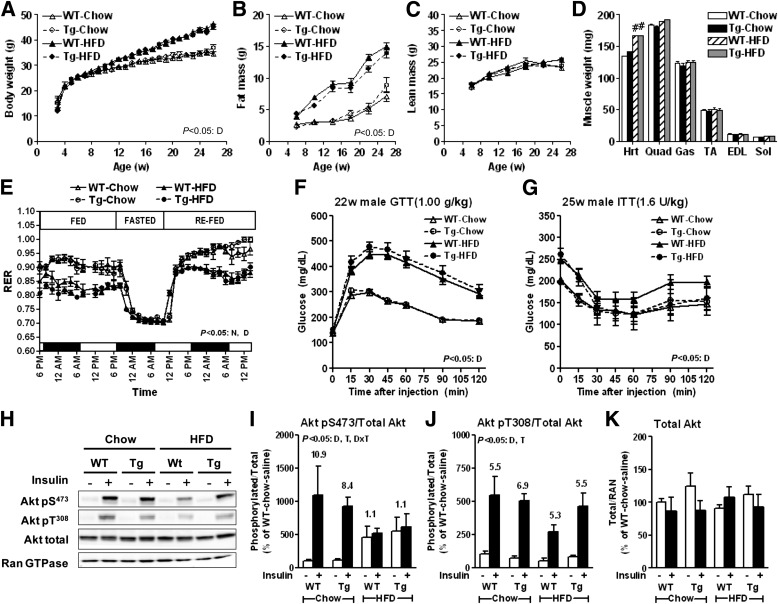
Intramyocellular triacylglycerol (IMTG) accumulation is highly associated with insulin resistance and metabolic complications of obesity (lipotoxicity), whereas comparable IMTG accumulation in endurance-trained athletes is associated with insulin sensitivity (the athlete's paradox). Despite these findings, it remains unclear whether changes in IMTG accumulation and metabolism per se influence muscle-specific and systemic metabolic homeostasis and insulin responsiveness. By mediating the rate-limiting step in triacylglycerol hydrolysis, adipose triglyceride lipase (ATGL) has been proposed to influence the storage/production of deleterious as well as essential lipid metabolites. However, the physiological relevance of ATGL-mediated triacylglycerol hydrolysis in skeletal muscle remains unknown. To determine the contribution of IMTG hydrolysis to tissue-specific and systemic metabolic phenotypes in the context of obesity, we generated mice with targeted deletion or transgenic overexpression of ATGL exclusively in skeletal muscle. Despite dramatic changes in IMTG content on both chow and high-fat diets, modulation of ATGL-mediated IMTG hydrolysis did not significantly influence systemic energy, lipid, or glucose homeostasis, nor did it influence insulin responsiveness or mitochondrial function. These data argue against a role for altered IMTG accumulation and lipolysis in muscle insulin resistance and metabolic complications of obesity.


Figures

FIG. 1.
FIG. 1.
Fiber type–specific expression of endogenous ATGL in murine skeletal muscle and regulation by HFD feeding. ATGL protein expression (ATGL IF in 2B fibers of GAKO mice set to 0) (A) and IMTG content by ORO staining (ORO IF of 2B fibers of WT mice set to 1) (B) in skeletal muscle fibers of chow-fed WT versus GAKO mice (♀, chow, 10 weeks, C57BL/6, gastrocnemius-plantaris-soleus [GPS] complex; n = 3 to 4/group). ATGL protein expression (ATGL IF in 2B fibers of WT-chow mice set to 1) (C) and IMTG content by ORO staining (ORO IF in 2B fibers of WT-chow mice set to 1) (D) in skeletal muscle fibers of chow- versus HFD-fed WT mice (♀, 22 weeks FVB, GPS complex; n = 3 to 4/group). E: Relationship between ATGL and IMTG (data from C and D). F: Representative images of ATGL and ORO IF in chow- and HFD-fed mice demonstrating overlap and enhanced staining with HFD. For overall effects having P < 0.05: D, diet; F, fiber type; G, genotype. For specific comparisons having P < 0.05: #for effect of diet; *for effect of genotype. AU, arbitrary units.
FIG. 2.
FIG. 2.
Skeletal muscle–specific ATGL deletion and its impact on lipid homeostasis in SMAKO mice. A: The LoxP-modified ATGL construct. B: ATGL mRNA expression relative to 18S control gene by quantitative PCR in muscle and nonmuscle tissues with endogenous ATGL expression in quadriceps arbitrarily set to 1 (♀, 10 weeks, chow, fasted 12 h; n = 5 to 6/group). Percent decrease in ATGL mRNA expression in SMAKO relative to WT mice for select muscle tissues is shown in the table (bottom). C: ATGL protein expression relative to Ran GTPase (RAN) control in skeletal versus cardiac muscle (♀, 10 weeks, chow, fasted 12 h, gastrocnemius and heart; n = 5 to 6/group). D: TAG hydrolase activity at baseline and in the presence of the HSL-specific inhibitor 76-0079, the ATGL-specific activator CGI-58, or HSL inhibitor plus CGI-58 (♂, 28 weeks, chow, fasted 12 h, red gastrocnemius; n = 6/group). E: Skeletal muscle histology of control (left), SMAKO (middle), and GAKO (right) mice including general morphology by H&E staining (top) and IMTG content by ORO staining (bottom) (♂, 28 weeks, chow, fasted 12 h, gastrocnemius-plantaris-soleus [GPS] complex). F: IMTG content by ORO staining using quantitative IF (♂, 28 weeks, fasted 12 h, GPS complex, average of four muscle areas each; n = 4/group). Type 2B fibers of chow-fed WT mice are arbitrarily set to 1. G: Intramyocellular DAG, ceramide, and FA-CoA content using biochemical analysis of whole muscle (♂, 28 weeks, fasted 12 h, quadriceps; n = 3 to 4/group). For overall effects having P < 0.05: D, diet; F, fiber type; G, genotype; T, treatment (with HSL-inhibitor or CGI-58). For specific comparisons having P < 0.05: #for effect of diet; *for effect of genotype; and @for effect of treatment. AU, arbitrary units; BAC, bacterial artificial chromosome; BAT, brown adipose tissue; D, diet; EDL, extensor digitorum longus; ES, embryonic stem; Gas, gastrocnemius; Hrt, heart; PGAT, perigonadal adipose tissue; Quad, quadriceps; Sol, soleus; TA, tibialis anterior.
FIG. 3.
FIG. 3.
Skeletal muscle mitochondrial function and expression of genes/proteins regulating lipid homeostasis in SMAKO mice. A: FA oxidation (♂, 28 weeks, fasted 12 h, red gastrocnemius; n = 6/group). 14C-labeled incorporation into CO2 and acid-soluble metabolites (ASMs) represent complete and incomplete oxidation, respectively. B: Mitochondrial respiration in permeabilized muscle fibers (♂, 28 weeks, fasted 12 h, soleus; n = 6/group). Oxygen consumption was measured following the sequential addition of the following substrates: palmitoylcarnitine (P), malate (M), ADP (D), glutamate (G), succinate (S), and cytochrome c, oligomycin, and carbonylcyanide-p-trifluoromethoxyphenylhydrazone (FCCP). The corresponding respiratory states are noted: ADP-driven respiration (state 3), respiration in the absence of ADP (state 4), and uncoupled respiration (state U). C: Expression of oxidative phosphorylation proteins in complexes I–V (NDUFB8 [complex I], SDHB [complex II], UQCRC2 [complex III], MTCO1 [complex IV], and ATP5A [complex V]) (♂, 28 weeks, fasted 12 h, tibialis anterior; n = 6/group). Data are normalized to protein expression of β-actin. D: TEM of skeletal muscle (♂, 28 weeks, fasted 12 h, red quadriceps, representative images). mRNA expression of PPARα/PGC1α and their target genes (E) and genes for lipid breakdown (lipolysis), uptake, and synthesis as well as lipid droplet–associated proteins (LDAPs) of the Plin family (F) relative to cyclophilin control with expression in WT-chow normalized to 1 (♂, 28 weeks, tibialis anterior; n = 9–13/group). G: Protein expression of total HSL normalized to Ran GTPase (RAN) control (left), phosphorylated HSL normalized to total HSL (middle), and representative immunoblots (right) (♂, 28 weeks, tibialis anterior; n = 4/group). For mRNA and protein expression, samples were confirmed to have low or no expression of Plin1, thereby confirming absence of significant fat contamination. For overall effects having P < 0.05: D, diet; G, genotype. Where an interaction was identified, specific comparisons having P < 0.05: *for effect of genotype.
FIG. 4.
FIG. 4.
Energy/glucose homeostasis and insulin action in SMAKO mice. Body weight (A), fat mass (B), and lean mass (C) (♂, 3–28 weeks; n ≥ 19/group). D: Muscle weights. With the exception of heart, data represent the average weight for both muscles from each mouse (♂, 28 weeks, fasted 12 h; n ≥ 19/group). EDL, extensor digitorum longus; Gas, gastrocnemius; Hrt, heart; Plant, plantaris; Quad, quadriceps; Sol, soleus; TA, tibialis anterior. E: RER using a Comprehensive Lab Animal Monitoring System (CLAMS) (♂, 11 weeks, weight-matched; n = 4/group). F: GTT at 19 weeks with 1.875 g/kg glucose i.p. (♂, fasted 12 h; n = 17–20/group). G: ITT at 20 weeks with 1.1 units/kg insulin i.p. (♂, fasted 4 h; n = 17–20/group). HK: Insulin signaling studies: mice were fasted for 12 h, injected i.p. with saline or insulin at 10 units/kg body weight, and killed 10 min thereafter (♂, 28 weeks, tibialis anterior; n = 5–7/group). Representative immunoblots (H) and associated quantification of stoichiometric phosphorylation of Akt pS473/Akt total (I), Akt pT308/Akt total (J), and total Akt/Ran GTPase (RAN) control (K). Fold change in response to insulin treatment is indicated above the black bars. For overall effects having P < 0.05: D, diet; G, genotype; N, nutritional status (i.e., fasting/refeeding); T, treatment (i.e., with insulin). For clarity, only overall effects are shown.
FIG. 5.
FIG. 5.
Skeletal muscle–specific overexpression of ATGL and its impact on lipid homeostasis. A: The Ckm-ATGL transgene construct. B: ATGL mRNA expression relative to 18S control gene by quantitative PCR in muscle and nonmuscle tissues with endogenous ATGL expression in quadriceps arbitrarily set to 1 (Line 1, ♀, 8 weeks, chow, fasted 12 h; n = 4–5/group). The fold-increase in ATGL mRNA expression in Tg relative to WT mice for select muscle tissues in each of two founder lines is shown in the table (bottom). C: ATGL protein expression relative to Ran GTPase (RAN) control as determined by immunoblotting in skeletal versus cardiac muscle (Line 1, ♀, 17 weeks, chow, fasted 12 h, gastrocnemius and heart; n = 6/group). D: ATGL IF in skeletal muscle (Line 1, ♂, 17 weeks, chow, fasted 12 h, gastrocnemius). E: Quantitative fiber type–specific ATGL protein expression by IF (Line 1, ♂, 28 weeks, chow and HFD, fasted 12 h, gastrocnemius-plantaris-soleus [GPS] complex, average of four muscle areas each; n = 4/group). Type 2B fibers of chow-fed WT mice are arbitrarily set to 1. F: TAG hydrolase activity in the absence (basal) and presence of the HSL-specific inhibitor 76-0079 (Line 1, ♂, 12 weeks, chow, fasted 12 h, gastrocnemius; n = 3/group). G: Skeletal muscle histology of control (left) and Tg (right) mice including general morphology by H&E staining (top) and IMTG content by ORO staining (bottom) (Line 1, ♂, 12 weeks, HFD for 4 weeks, fasted 12 h, GPS complex). H: IMTG content by ORO staining using quantitative IF (Line 1, ♂, 28 weeks, chow and HFD, fasted 12 h, GPS complex, average of four muscle areas each; n = 4/group). Type 2B fibers of chow-fed WT mice are arbitrarily set to 1. I: Intramyocellular DAG, ceramide, and FA-CoA content using biochemical analysis of whole muscle (Line 1, ♂, 28 weeks, chow and HFD, fasted 12 h, quadriceps; n = 3/group). For overall effects having P < 0.05: D, diet; F, fiber type; G, genotype; T, treatment (with HSL-inhibitor). For specific comparisons having P < 0.05: #for effect of diet; *for effect of genotype; and @for effect of treatment. AU, arbitrary units; BAT, brown adipose tissue; EDL, extensor digitorum longus; Gas, gastrocnemius; Hrt, heart; Panc, pancreas; PGAT, perigonadal adipose tissue; Quad, quadriceps; Sol, soleus; TA, tibialis anterior.
FIG. 6.
FIG. 6.
Skeletal muscle mitochondrial function and expression of genes/proteins regulating lipid homeostasis in Ckm-ATGL mice. A: FA oxidation (♂, 28 weeks, fasted 12 h, red gastrocnemius; n = 5–8/group). B: Mitochondrial respiration in permeabilized muscle fibers (♂, 34 weeks, fasted 12 h, extensor digitorum longus; n = 3–6/group). C: Expression of oxidative phosphorylation proteins in complexes I–V (♂, 34 weeks, fasted 12 h, tibialis anterior; n = 4–7/group). Data are normalized to protein expression of β-actin. D: TEM of skeletal muscle (♂, 34 weeks, fasted 12 h, red quadriceps, representative images). mRNA expression of PPARα/PGC1α and their target genes (E) and genes for lipid breakdown (lipolysis), uptake, and synthesis as well as lipid droplet–associated proteins (LDAPs) of the Plin family (F) relative to cyclophilin control with expression in WT-chow normalized to 1 (♂, 34 weeks, tibialis anterior; n = 7–21/group). G: Protein expression of total HSL normalized to Ran GTPase (RAN) control (left), phosphorylated HSL normalized to total HSL (middle), and representative immunoblots (right) (♂, 34 weeks, tibialis anterior; n = 5–7/group). For mRNA and protein expression, samples were confirmed to have low or no expression of Plin1, thereby confirming absence of significant fat contamination. For overall effects having P < 0.05: D, diet; G, genotype.
FIG. 7.
FIG. 7.
Energy/glucose homeostasis and insulin action in Ckm-ATGL mice. Body weight (A), fat mass (B), and lean mass (C) (Line 1, ♂, 3–26 weeks; n ≥ 12/group). D: Muscle weights (nonmuscle tissue weights also showed no genotype effects; data not shown). With the exception of heart, data represent the average weight for both muscles from each mouse (Line 1, ♂, 28 weeks, fasted 12 h; n ≥ 24/group). EDL, extensor digitorum longus; Gas, gastrocnemius; Hrt, heart; Quad, quadriceps; Sol, soleus; TA, tibialis anterior. E: RER using a Comprehensive Lab Animal Monitoring System (CLAMS) (Line 1, ♂, 9 weeks, weight-matched; n = 4/group). F: GTT at 22 weeks with 1.0 g/kg glucose i.p. (♂, fasted 12 h; n = 7–22/group). G: ITT at 25 weeks with 1.6 units/kg insulin i.p. (Line 1, ♂, fasted 4 h; n = 7–22/group). HK: Insulin signaling studies: Mice were fasted for 12 h, injected i.p. with saline or insulin at 10 units/kg body weight, and killed 10 min thereafter (♂, 34 weeks, tibialis anterior; n = 57/group). Representative immunoblots (H) and associated quantification of stoichiometric phosphorylation of Akt pS473/Akt total (I), Akt pT308/Akt total (J), and total Akt/Ran GTPase control (K). Fold change in response to insulin treatment is indicated above the black bars. For overall effects having P < 0.05: D, diet; N, nutritional status (i.e., fasting/refeeding); T, treatment (i.e., with insulin). For clarity, only overall effects are shown. For simple effects in D, #P < 0.05 for effect of diet.

Comment in

Similar articles

Cited by

References

    1. Schaffer JE. Lipotoxicity: when tissues overeat. Curr Opin Lipidol 2003;14:281–287 - PubMed
    1. Goodpaster BH, He J, Watkins S, Kelley DE. Skeletal muscle lipid content and insulin resistance: evidence for a paradox in endurance-trained athletes. J Clin Endocrinol Metab 2001;86:5755–5761 - PubMed
    1. Samuel VT, Shulman GI. Mechanisms for insulin resistance: common threads and missing links. Cell 2012;148:852–871 - PMC - PubMed
    1. Cowart LA. Sphingolipids: players in the pathology of metabolic disease. Trends Endocrinol Metab 2009;20:34–42 - PubMed
    1. Amati F. Revisiting the diacylglycerol-induced insulin resistance hypothesis. Obes Rev 2012;13(Suppl. 2):40–50 - PubMed

Publication types

Substances