. 2013 Nov;62(11):3817-27.
doi: 10.2337/db13-0399. Epub 2013 Jul 8.

Cyclodextrin protects podocytes in diabetic kidney disease

Affiliations

Cyclodextrin protects podocytes in diabetic kidney disease

Sandra Merscher-Gomez et al. Diabetes. 2013 Nov.

Abstract

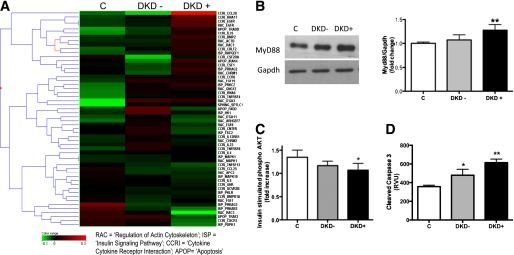
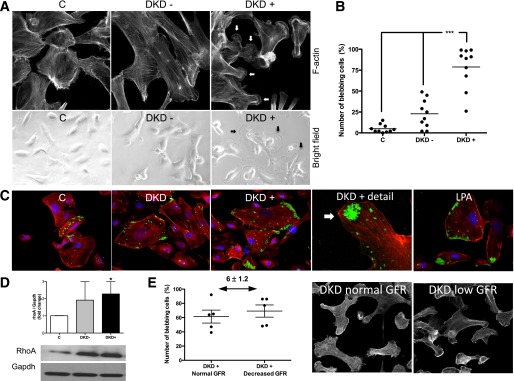
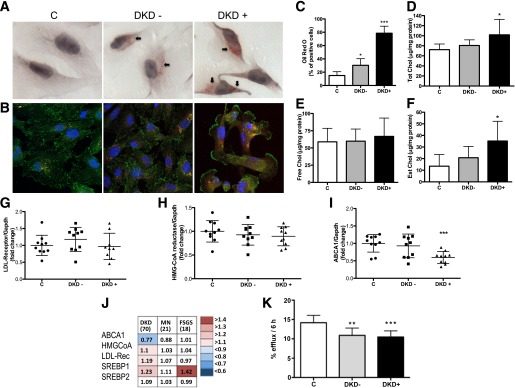
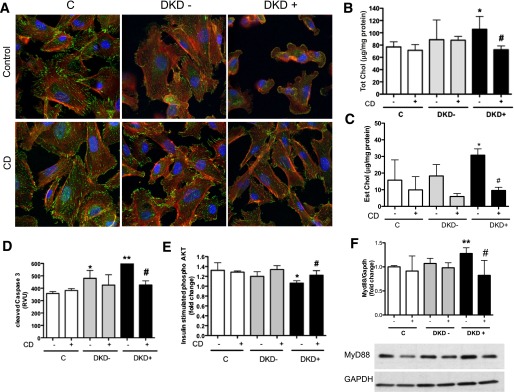
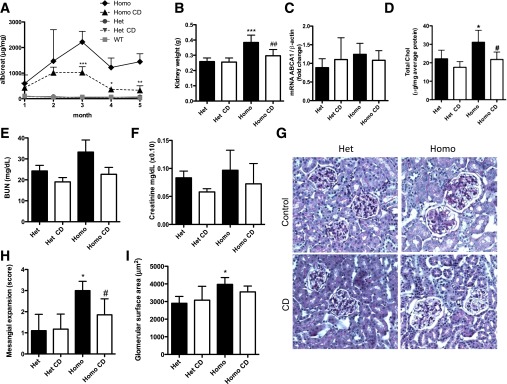
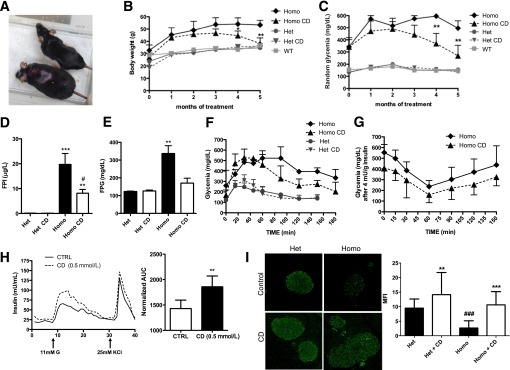
Diabetic kidney disease (DKD) remains the most common cause of end-stage kidney disease despite multifactorial intervention. We demonstrated that increased cholesterol in association with downregulation of ATP-binding cassette transporter ABCA1 occurs in normal human podocytes exposed to the sera of patients with type 1 diabetes and albuminuria (DKD(+)) when compared with diabetic patients with normoalbuminuria (DKD(-)) and similar duration of diabetes and lipid profile. Glomerular downregulation of ABCA1 was confirmed in biopsies from patients with early DKD (n = 70) when compared with normal living donors (n = 32). Induction of cholesterol efflux with cyclodextrin (CD) but not inhibition of cholesterol synthesis with simvastatin prevented podocyte injury observed in vitro after exposure to patient sera. Subcutaneous administration of CD to diabetic BTBR (black and tan, brachiuric) ob/ob mice was safe and reduced albuminuria, mesangial expansion, kidney weight, and cortical cholesterol content. This was followed by an improvement of fasting insulin, blood glucose, body weight, and glucose tolerance in vivo and improved glucose-stimulated insulin release in human islets in vitro. Our data suggest that impaired reverse cholesterol transport characterizes clinical and experimental DKD and negatively influences podocyte function. Treatment with CD is safe and effective in preserving podocyte function in vitro and in vivo and may improve the metabolic control of diabetes.


Figures

FIG. 1.
FIG. 1.
Expression analysis of podocytes cultured with patient sera. A: cRNA beadchip analysis was performed using cRNA isolated from human podocytes exposed to pooled sera from control patients and patients without (DKD) or with kidney disease (DKD+). Quadruplicate expression data analysis was performed after batch correction. Significant probes (n = 1,015) were identified as differentially expressed between DKD and DKD+, and pathway analysis revealed that four major pathways were modulated as shown in the heatmap. B: Bar graph analysis (mean ± SD) and representative Western blot analysis of four independent experiments demonstrating increased MyD88 protein expression in DKD+-treated podocytes when compared with C. **P < 0.01. C: Bar graph analysis (mean ± SD) of fold changes in phosphorylated AKT/total AKT after insulin stimulation in four different experiments. Data were analyzed with Luminex technology and demonstrated decreased cellular insulin sensitivity in DKD+- and DKD-treated cells when compared with C. *P < 0.05. D: Bar graph analysis (mean ± SD) of cleaved caspase 3 analyzed in four independent experiments, demonstrating increased cleaved caspase 3 in DKD+-treated cells when compared with C. *P < 0.05; **P < 0.01. RVU, relative value units.
FIG. 2.
FIG. 2.
Actin remodeling in DKD+ sera–treated podocytes. A: Representative F-actin staining (top) and bright field images (bottom) of podocytes exposed to DKD+ sera when compared with C and DKD sera, demonstrating cell blebbing in DKD+ serum–treated cells. White and black arrows point to areas of cell blebbing. B: Quantitative analysis of cell blebs (mean ± SD) observed in podocytes exposed to individual DKD+ sera when compared with DKD and C. ***P < 0.001. C: Representative immunofluorescence images demonstrating the localization of active RhoA (green) at the sites of cell blebbing in DKD+ serum–treated podocytes. Lysophosphatidic acid (LPA)–induced RhoA activation was used as positive control. F-actin is visualized in red (rhodamine phalloidin) and nuclei in blue (DAPI). D: Bar graph analysis (mean ± SD) and representative Western blot of four independent experiments demonstrating increased total RhoA in DKD+ serum–treated podocytes when compared with C. *P < 0.01. E: Quantitative analysis (mean ± SD) of the number of podocytes showing cell blebbing after exposure to the sera of five patients with DKD+ and decreased GFR when compared with the sera collected from the same five patients 6 years prior when they had normal GFR. No significant differences were observed. A representative F-actin staining of cell blebbing is also shown. Clinical characteristics of the patients are shown in Supplementary Table 2.
FIG. 3.
FIG. 3.
Cholesterol accumulation in podocytes exposed to DKD+ sera. A: Representative ORO staining of podocytes exposed to DKD+ sera when compared with C and DKD sera. Black arrows point to spots of major lipid droplet accumulation. B: Representative filipin staining (orange) and phosphorylated caveolin staining (green) of podocytes exposed to DKD+ sera when compared with C and DKD. C: Bar graph quantitative analysis (mean ± SD) of ORO-positive cells in podocytes exposed to the pools of sera from 10 patients with DKD or DKD+ or to pools of the sera from controls, demonstrating that exposure to both DKD and DKD+ sera causes significant lipid droplet accumulation in cultured human podocytes. *P < 0.05; ***P < 0.001. DF: Bar graph analysis (mean ± SD) of total cholesterol (Tot C), free cholesterol (Free C), and esterified cholesterol (Est C) as determined via enzymatic reaction in podocytes exposed to pools of DKD+ sera when compared with C and DKD. *P < 0.05. GI: Quantitative RT-PCR analysis (mean ± SD) of LDL receptor HMG-CoA reductase and ABCA1 expression in podocytes exposed to individual patient sera. ***P < 0.001. J: Expression analysis of glomerular gene expression of lipid-related genes in 70 patients with early DKD, 21 patients with membranous nephropathy (MN), and 18 patients with FSGS when compared with 32 living donors. Numbers reflect fold change in disease when compared with living donors. Genes passing an FDR correction (qvalue) for multiple testing <5% were considered significantly regulated genes with significant changes in gene expression and are highlighted by blue or red background colors. K: Cholesterol efflux assay demonstrating decreased cholesterol efflux after 6 h in podocytes treated with DKD (P < 0.01) and DKD+ (P < 0.001) sera when compared with C. **P < 0.01; ***P < 0.001.
FIG. 4.
FIG. 4.
CD protects podocytes from changes observed after exposure to DKD+ sera. A: Representative phalloidin (red) and phosphorylated caveolin (green) confocal images of normal human podocytes exposed to DKD+ sera when compared with C and DKD sera in the presence (CD) or absence (control) of CD. DAPI (blue) was used to identify nuclei. Bar graph analysis (mean ± SD) of the effect of CD on total (B) and esterified cholesterol (C) in CD-treated (+) vs. untreated (−) podocytes exposed to DKD+ sera when compared with C and DKD sera. *P < 0.05, when comparing DKD+ vs. C. #P < 0.05, when comparing CD-treated vs. untreated podocytes in the same group. DF: Bar graph analysis (mean ± SD) of cleaved caspase 3, insulin-stimulated AKT phosphorylation, and MyD88 expression in CD-treated (+) vs. untreated (−) podocytes exposed to DKD+ sera when compared with C and DKD sera. *P < 0.05 and **P < 0.01, when comparing DKD+ vs. C. #P < 0.05, when comparing CD-treated vs. untreated podocytes in the same group. RVU, relative value units.
FIG. 5.
FIG. 5.
CD protects from DKD in vivo. A: CD administered to homozygous and heterozygous BTBR ob/ob mice subcutaneously three times a week (n = 6 per group) resulted in a reduction in albumin/creatinine ratios (mean ± SD) starting at 3 months after the initiation of the treatment. *P < 0.05; **P < 0.01; ***P < 0.001. B: Kidney weight (mean ± SD) was significantly increased in homozygous mice (***P < 0.001), and such an increase was prevented by CD treatment (##P < 0.01). C: Bar graph analysis (mean ± SD) of the effect of CD on ABCA1 mRNA expression in kidney cortexes of homozygous and heterozygous BTBR ob/ob mice. D: Bar graph analysis (mean ± SD) of the effect of CD on the total cholesterol content in kidney cortexes of homozygous and heterozygous BTBR ob/ob mice. E and F: Bar graph analysis (mean ± SD) showing that serum BUN and creatinine concentrations remain unchanged after CD treatment of the mice. Measurements were performed on serum obtained from the mice at sacrifice. G: Representative PAS staining of kidney sections from homozygous and heterozygous BTBR ob/ob mice after 5 months of treatment with either CD or vehicle. Bar graph analysis (mean ± SD) of the scores for mesangial expansion (H) and of the glomerular surface area (I) on PAS-stained kidney sections from homozygous and heterozygous BTBR ob/ob mice after 5 months of treatment with either CD or vehicle were assessed by two blinded, independent investigators. *P < 0.05, when comparing DKD+ vs. C. #P < 0.05, when comparing CD-treated vs. untreated mice in the same group. Het, heterozygous; Homo, homozygous; WT, wild type.
FIG. 6.
FIG. 6.
CD improves diabetes in vivo. A and B: CD administered to homozygous and heterozygous BTBR ob/ob mice subcutaneously three times a week (n = 6 per group) resulted in a significant reduction in body weight (mean ± SD) starting at 4 months after the initiation of the treatment. *P < 0.05; **P < 0.01. C: CD administered to homozygous BTBR ob/ob mice resulted in a significant reduction in random glycemia (mean ± SD) starting at 4 months after the initiation of the treatment. Bar graph analysis (mean ± SD) of fasting plasma insulin (FPI) and glucose concentrations. FPI (**P < 0.01; ***P < 0.001; #P < 0.05) (D) and fasting plasma glucose (FPG) (**P < 0.01) (E) were significantly increased in homozygous mice when compared with heterozygous controls. The increase was prevented by CD treatment (#P < 0.05). F: IPGTTs performed at 5 months after the initiation of the CD treatment showed improved glucose tolerance in CD-treated BTBR ob/ob mice when compared with untreated BTBR ob/ob mice. G: CD treatment did not affect the sensitivity to a single dose of short-acting insulin (4 mU/g) in BTBR ob/ob mice. H: Representative perifusion experiment and bar graph analysis of the area under the curve demonstrating the effect of 0.5 mmol/L CD on glucose-stimulated insulin release in human pancreatic islets from four independent donors (**P < 0.01). I: Immunofluorescence staining for ABCA1 reveals increased ABCA1 expression in pancreata of CD-treated BTBR ob/ob mice when compared with untreated littermates (left). Bar graph analysis (right) showing that pancreata isolated from homozygous BTBR ob/ob mice are characterized by significantly decreased ABCA1 expression when compared with heterozygous littermates (###P < 0.001). CD treatment significantly increased ABCA1 expression in pancreata of homozygous BTBR ob/ob (***P < 0.001) and heterozygous BTBR ob/+ mice (**P < 0.01). AUC, area under the curve; CTRL, control; Het, heterozygous; Homo, homozygous; MFI, mean fluorescent intensity; WT, wild type.

Comment in

References

    1. U.S. Renal Data System USRDS 2011 Annual Data Report: Atlas of Chronic Kidney Disease and End-Stage Renal Disease in the United States. Bethesda, MD, National Institutes of Health, National Institute of Diabetes and Digestive and Kidney Diseases, 2011
    1. Gaede P, Lund-Andersen H, Parving HH, Pedersen O. Effect of a multifactorial intervention on mortality in type 2 diabetes. N Engl J Med 2008;358:580–591 - PubMed
    1. Hovind P, Tarnow L, Rossing K, et al. Decreasing incidence of severe diabetic microangiopathy in type 1 diabetes. Diabetes Care 2003;26:1258–1264 - PubMed
    1. Somlo S, Mundel P. Getting a foothold in nephrotic syndrome. Nat Genet 2000;24:333–335 - PubMed
    1. American Diabetes Association Standards of medical care in diabetes—2011. Diabetes Care 2011;34(Suppl. 1):S11–S61 - PMC - PubMed

Publication types

MeSH terms