Review
. 2013 Aug;14(8):572-84.
doi: 10.1038/nrg3484. Epub 2013 Jul 9.

Eukaryotic transcriptional dynamics: from single molecules to cell populations

Affiliations
Review

Eukaryotic transcriptional dynamics: from single molecules to cell populations

Antoine Coulon et al. Nat Rev Genet. 2013 Aug.

Abstract

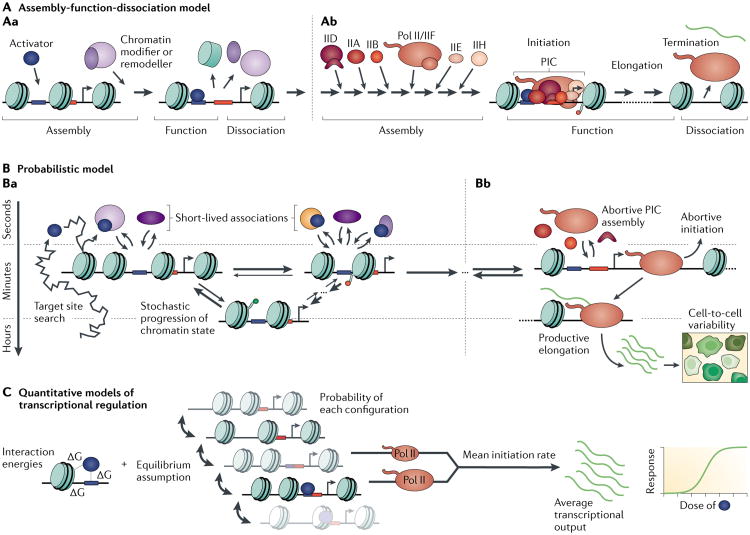
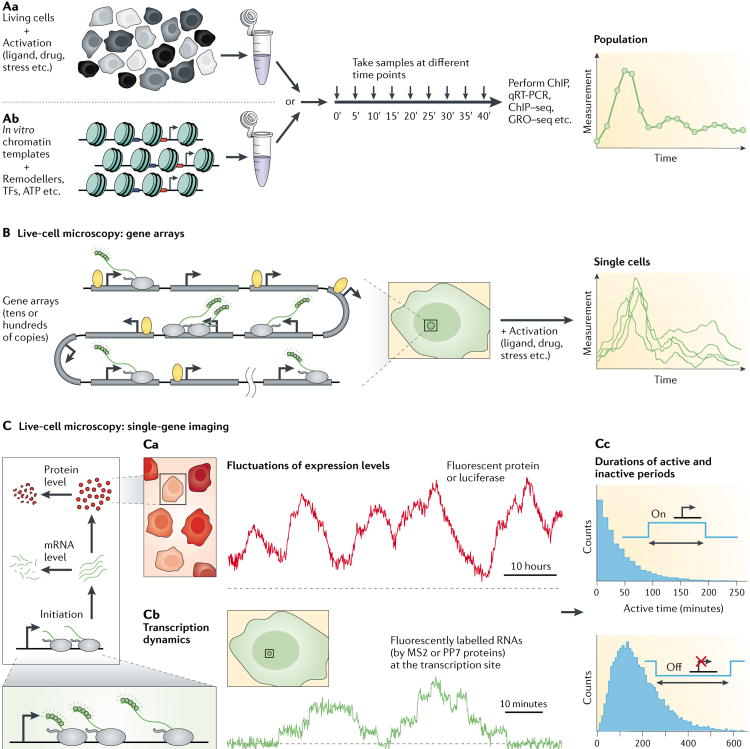
Transcriptional regulation is achieved through combinatorial interactions between regulatory elements in the human genome and a vast range of factors that modulate the recruitment and activity of RNA polymerase. Experimental approaches for studying transcription in vivo now extend from single-molecule techniques to genome-wide measurements. Parallel to these developments is the need for testable quantitative and predictive models for understanding gene regulation. These conceptual models must also provide insight into the dynamics of transcription and the variability that is observed at the single-cell level. In this Review, we discuss recent results on transcriptional regulation and also the models those results engender. We show how a non-equilibrium description informs our view of transcription by explicitly considering time- and energy-dependence at the molecular level.


Figures

Figure 1
Figure 1. Points of view on transcriptional regulation
Three schemes are shown that emphasize different aspects of transcription and gene regulation. Although these descriptions are not mutually exclusive, each scheme results in a particular bias regarding the temporal behaviour of single genes. A | The assembly–function–dissociation model. Experimental approaches based mostly on in vitro reconstitution or bulk, population-level assays aim to determine the molecular players that are involved at different stages in the transcription process. These methods clearly show that transcriptional activation is the result of a series of events that occur in a certain sequence. However, this scheme tends to describe the recruitment of complexes as a rather static and deterministic process. The example shown is of transcription initiation: Aa shows the uncovering of binding sites for the core machinery and Ab shows ordered assembly of the pre-initiation complex (PIC). B | The probabilistic model, showing the same stages of transcription as in panel A. Experiments based primarily on fluorescence microscopy can address questions relating to the kinetic aspects of transcription over various timescales. Such experiments have revealed that interaction times vary substantially but are generally short for most regulatory molecules. They show various slow temporal patterns in the transcriptional responses, with a substantial level of cell-to-cell variability. Coloured shapes represent factors that interact with chromatin (represented by a stretch of nucleosomal DNA). Curved arrows represent short-lived associations; arrows of different weights represent reversible reactions in which the forward and reverse reactions have different probabilities. C | Quantitative models of transcriptional regulation. Computational methods have been developed to quantitatively relate the concentration of regulators to average transcriptional activity, based on protein–DNA and protein–protein interactions. These models generally do not explicitly consider the intrinsic dynamics of the processes involved. In the example shown, the interaction energies between a factor, a binding site and a nucleosome (left) are used to compute the probabilities of different configurations of the regulatory region of the gene (centre). Given the different rates of transcription initiation that each configuration would lead to (represented by different sized polymerases), this approach can relate the concentration of the regulator to the transcriptional output of the gene (shown in the graph on the right). IID, transcription factor IID; Pol II, RNA polymerase II.
Figure 2
Figure 2. Experimental techniques to study transcriptional kinetics
The dynamics of transcription can be probed using various techniques. A | Promoter occupancy and transcriptional output can be followed over time using bulk assays on either living cells (Aa) or reconstituted in vitro systems (Ab), thus yielding a population-level view of transcription dynamics. An example workflow for this type of experiment is shown. B | Live-cell imaging of gene arrays (gene copies are shown in grey) provides a single-cell picture, but this method still involves taking average readings across many copies of the gene of interest. Nascent RNAs visualized using MS2 and/or PP7 RNA labelling are shown in green. C | Single-gene dynamics can be probed either by following the fluctuations of fluorescence or luciferase activity of a reporter gene product (Ca) or directly at the transcription site, by monitoring the amount of nascent RNAs labelled with MS2 or PP7 fluorescent proteins(Cb). The resulting time traces can be interpreted using fluctuation correlation analysis or hidden Markov methods to reveal the kinetic scheme that the gene is following (for example, stochastic bursting or constitutive initiation). Single-gene methods also allow the estimation of parameters such as the initiation rate, the elongation time or (as shown in Cc) the distributions of time the gene remains in an active or inactive state. Data shown in C are simulated on the basis of schemes and parameters that are consistent with recent single-gene studies,,. ChIP, chromatin immunoprecipitation; ChIP–seq, ChIP followed by high-throughput sequencing; GRO-seq, genomic nuclear run-on followed by high-throughput sequencing; qRT-PCR, quantitative reverse-transcription PCR; TFs, transcription factors.

References

    1. McNally JG, Muller WG, Walker D, Wolford R, Hager GL. The glucocorticoid receptor: rapid exchange with regulatory sites in living cells. Science. 2000;287:1262–1265. - PubMed
    1. Dundr M, et al. A kinetic framework for a mammalian RNA polymerase in vivo. Science. 2002;298:1623–1626. - PubMed
    1. Dion MF, et al. Dynamics of replication-independent histone turnover in budding yeast. Science. 2007;315:1405–1408. This study measured the turnover rates of core histones on a genome-wide scale and reported dwell times on the order of tens of minutes that varied substantially between genomic locations. - PubMed
    1. Métivier R, Penot G, Hübner MR, Reid G, Brand H. Estrogen receptor-α directs ordered, cyclical, and combinatorial recruitment of cofactors on a natural target promoter. Cell. 2003;115:751–763. - PubMed
    1. Chubb JR, Trcek T, Shenoy SM, Singer RH. Transcriptional pulsing of a developmental gene. Curr Biol. 2006;16:1018–1025. - PMC - PubMed

Publication types

MeSH terms

Substances