. 2012 Nov 14;1(11):e14.
doi: 10.1038/psp.2012.15.

Predicting nonlinear changes in bone mineral density over time using a multiscale systems pharmacology model

Affiliations

Predicting nonlinear changes in bone mineral density over time using a multiscale systems pharmacology model

M C Peterson et al. CPT Pharmacometrics Syst Pharmacol. .

Abstract

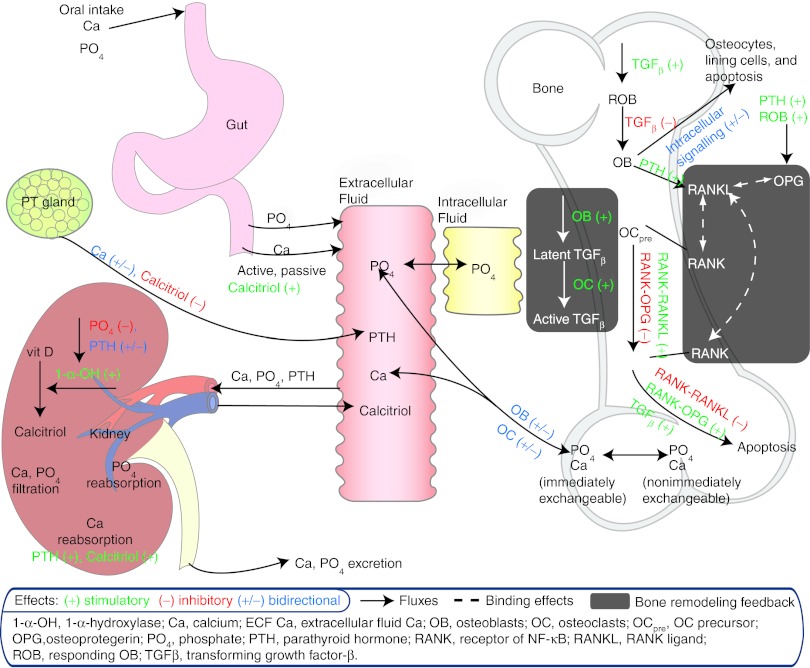
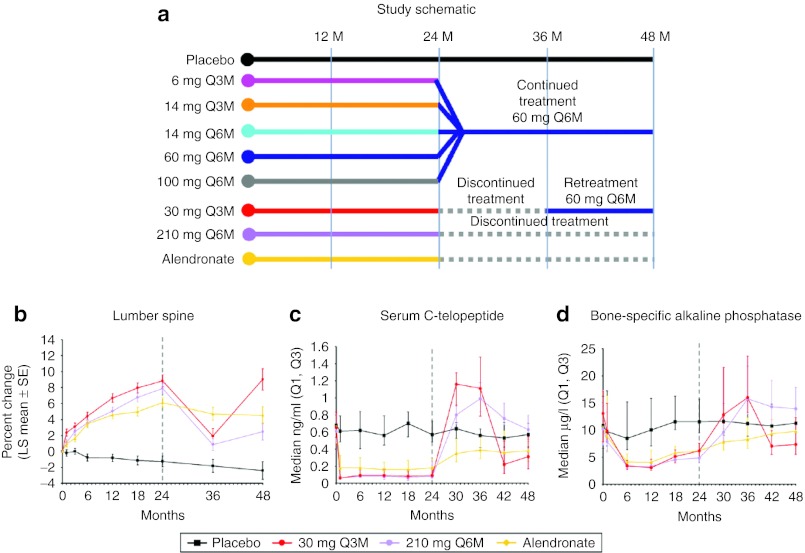
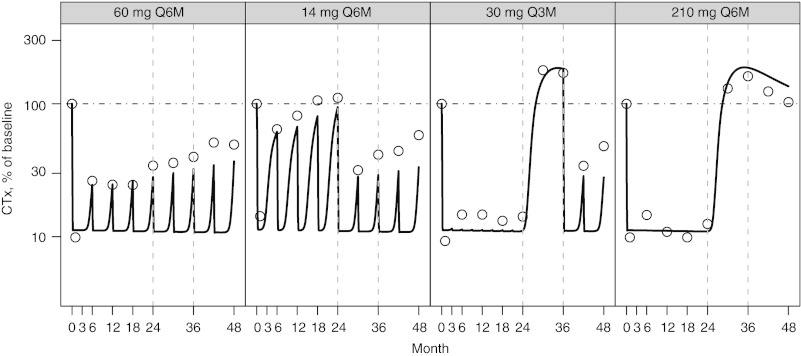
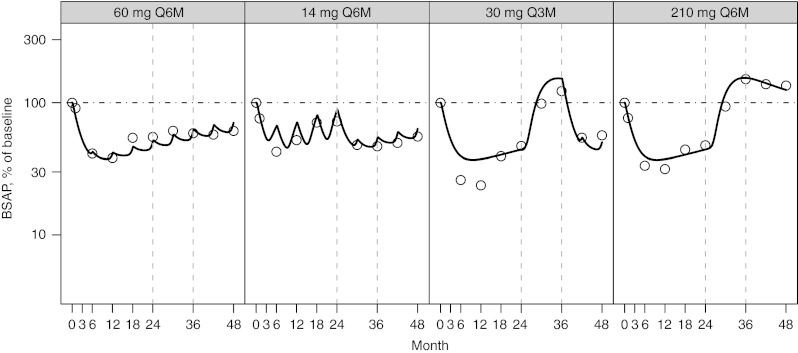
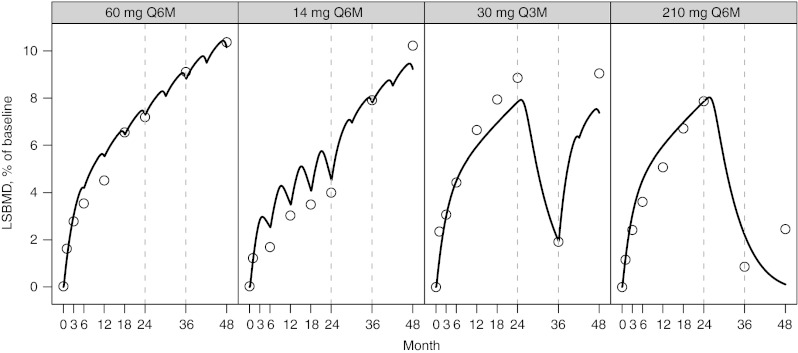
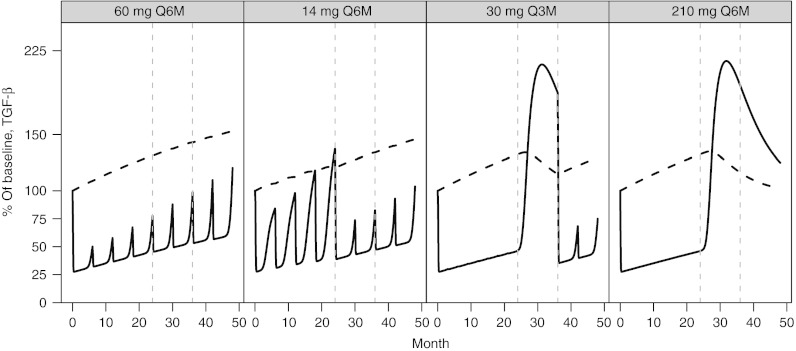
A mathematical model component that extends an existing physiologically based multiscale systems pharmacology model (MSPM) of calcium and bone homeostasis was developed, enabling prediction of nonlinear changes in lumbar spine bone mineral density (LSBMD). Data for denosumab, a monoclonal antibody osteoporosis treatment, dosed at several levels and regimens, was used for fitting the BMD component. Bone marker and LSBMD data extracted from the literature described on/off-treatment effects of denosumab over 48 months [Miller, P.D. et al. Effect of denosumab on bone density and turnover in postmenopausal women with low bone mass after long-term continued, discontinued, and restarting of therapy: a randomized blinded phase 2 clinical trial. Bone 43, 222-229 (2008)]. An indirect model linking bone markers to LSBMD was embedded in the existing MSPM, reasonably predicting nonlinear increases in LSBMD during treatment (24 months); LSBMD declines following discontinuation and increases upon treatment reinstitution. This study demonstrates the utility of MSPM extension to describe a phenomena of interest not originally in a model, and the ability of this updated MSPM to predict nonlinear longitudinal changes in the clinically relevant endpoint, LSBMD, with denosumab treatment.CPT: Pharmacometrics & Systems Pharmacology (2012) 1, e14; doi:10.1038/psp.2012.15; advance online publication 14 November 2012.


Figures

Figure 1
Figure 1
Schematic of physiologic system model to describe calcium homeostasis and bone remodeling (modified from Figure 1 of Peterson and Riggs).
Figure 2
Figure 2
(a) Study design for the denosumab dose ranging trial and (b) resulting mean lumbar spine bone mineral density percent change, (c) median serum C-telopeptide, and (d) median serum bone-specific alkaline phosphatase. Treatment groups are placebo (black), 30 mg every 3 months for 8 doses and changed to 60 mg every 6 months starting on month 36 (red); 210 mg every 6 months for four doses then discontinued (purple), and the active control, Alendronate (yellow). Reprinted from Miller et al.
Figure 3
Figure 3
Percent of baseline (%) for C-telopeptide (CTx) following NF-κB ligand inhibition with denosumab administered at (panels from left to right): 60 mg every 6 months (Q6M); 14 mg every Q6M for four doses and changed to 60 mg Q6M at month 24; 30 mg every 3 months for 8 doses and changed to 60 mg Q6M starting on month 36; 210 mg every 6 months for four doses then discontinued. Open circles present observed CTx and model-predicted values are represented by the solid line. A horizontal reference (dotted line) is included on each figure at the baseline value of 100%. Observed values were reproduced from Miller et al.
Figure 4
Figure 4
Percent of baseline (%) for serum bone-specific alkaline phosphatase (BSAP) following NF-κB ligand inhibition with denosumab administered at (panels from left to right): 60 mg every 6 months (Q6M); 14 mg every Q6M for four doses and changed to 60 mg Q6M at month 24; 30 mg every 3 months for 8 doses and changed to 60 mg Q6M starting on month 36; 210 mg every 6 months for four doses then discontinued. Open circles present observed BSAP and model-predicted values are represented by the solid line. A horizontal reference (dotted line) is included on each figure at the baseline value of 100%. Observed values were reproduced from Miller et al.
Figure 5
Figure 5
Percent of baseline (%) for lumbar spine bone mineral density (LSBMD) following NF-κB ligand inhibition with denosumab administered at (panels from left to right): 60 mg every 6 months (Q6M); 14 mg every Q6M for four doses and changed to 60 mg Q6M at month 24; 30 mg every 3 months for 8 doses and changed to 60 mg Q6M starting on month 36; 210 mg every 6 months for four doses then discontinued. Open circles present observed LSBMD and model-predicted values are represented by the solid line. A horizontal reference (dotted line) is included on each figure at the baseline value of 100%. Observed values were reproduced from Miller et al.
Figure 6
Figure 6
Percent of baseline (%) for transforming growth factor-β latent (dashed line) and active (solid line) following NF-κB ligand inhibition with denosumab administered at (panels from left to right): 60 mg every 6 months (Q6M); 14 mg every Q6M for four doses and changed to 60 mg Q6M at month 24; 30 mg every 3 months for 8 doses and changed to 60 mg Q6M starting on month 36; 210 mg every 6 months for four doses then discontinued.

References

    1. Organization W.H. Assessment of fracture risk and its application to screening for postmenopausal osteoporosis. Report of a WHO Study Group. World Health Organization technical report series. 1994;843:1–129. - PubMed
    1. Old J.L., &, Calvert M. Vertebral compression fractures in the elderly. Am. Fam. Physician. 2004;69:111–116. - PubMed
    1. Bliuc D., Nguyen N.D., Milch V.E., Nguyen T.V., Eisman J.A., &, Center J.R. Mortality risk associated with low-trauma osteoporotic fracture and subsequent fracture in men and women. JAMA. 2009;301:513–521. - PubMed
    1. Foundation I.O. The Burden of Brittle Bones Epidemiology, Costs & Burden of Osteoporosis in Australia—2007. International osteoporosis Foundation. 2007.
    1. Biver E.et al. Bone turnover markers for osteoporotic status assessment? A systematic review of their diagnosis value at baseline in osteoporosis Joint. Bone. Spine 7920–25.2012 - PubMed