. 2012 Nov 21;1(11):e15.
doi: 10.1038/psp.2012.16.

Multiscale kinetic modeling of liposomal Doxorubicin delivery quantifies the role of tumor and drug-specific parameters in local delivery to tumors

Affiliations

Multiscale kinetic modeling of liposomal Doxorubicin delivery quantifies the role of tumor and drug-specific parameters in local delivery to tumors

B S Hendriks et al. CPT Pharmacometrics Syst Pharmacol. .

Abstract

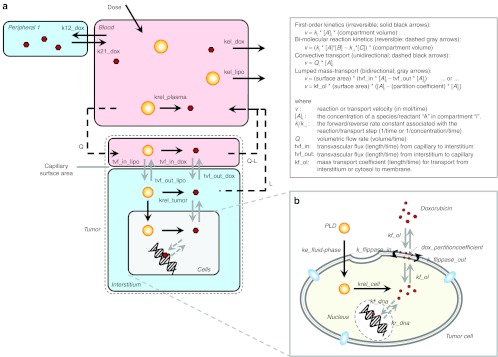
Nanoparticle encapsulation has been used as a means to manipulate the pharmacokinetic (PK) and safety profile of drugs in oncology. Using pegylated liposomal doxorubicin (PLD) vs. conventional doxorubicin as a model system, we developed and experimentally validated a multiscale computational model of liposomal drug delivery. We demonstrated that, for varying tumor transport properties, there is a regimen where liposomal and conventional doxorubicin deliver identical amounts of doxorubicin to tumor cell nuclei. In mice, typical tumor properties consistently favor improved delivery via liposomes relative to free drug. However, in humans, we predict that some tumors will have properties wherein liposomal delivery delivers the identical amount of drug to its target relative to dosing with free drug. The ability to identify tumor types and/or individual patient tumors with high degree of liposome deposition may be critical for optimizing the success of nanoparticle and liposomal anticancer therapeutics.CPT: Pharmacometrics & Systems Pharmacology (2012) 1, e15; doi:10.1038/psp.2012.16; advance online publication 21 November 2012.


Figures

Figure 1
Figure 1
Computational model diagram. (a) The physiologically based drug delivery model is shown in cartoon form. The model consists of a one-compartment pharmacokinetic (PK) model for liposomes (yellow circles) superimposed on a pseudo two-compartment model for doxorubicin (red hexagons). The two models are connected by the release of doxorubicin from the liposomes. A physiologically based tumor compartment (outlined with dashed line) is connected to the PK model. Doxorubicin must be released from liposomes to be active and once it is released, it is assumed to behave identical to free doxorubicin. (b) A cartoon of the detailed model of doxorubicin transport into and out of cells is shown. Doxorubicin partitions into the cell membrane and then is reversibly transported from the outer to inner leaflet of the membrane via flippases, dissociates into the cytosol, and then reversibly binds to DNA in the nucleus. The cellular model for doxorubicin transport is independently applied to cell line data and is also embedded within the larger mechanism-based model in a. Complete parameter descriptions and their values are shown in Table 1. The kinetic rate laws used for each reaction and/or transport step are shown in the box in the upper right. The complete model, including all reaction rate laws and parameter values is available in Supplementary Data online as well as a parameter and reaction list in Supplementary Tables S1 and S2 online. PLD, pegylated liposomal doxorubicin.
Figure 2
Figure 2
Total cellular doxorubicin uptake was measured in multiple cell lines (AdRr, OVCAR8, MCF7, HeLa, MKN-45, IGROV1, ZR75-1, MDA-MB-361, MDA-MB-453, 4T1-clone-12W7, OVCAR8-Her2, HCC1954, AdRr-Her2, JIMT-1, MCF7-c18, Calu-3, MKN-7, NCI-N87, SkBr3, SKOV3, and BT474-M3) following incubation with 3, 15, or 75 µg/ml of doxorubicin (squares, circles, and triangles, respectively) for up to 3 hours. (a) Time courses for 21 different cell lines following incubation with 15 µg/ml doxorubicin. The kinetic model for doxorubicin transport into and out of cells (see Figure 1b) was fit to the experimental data for each to estimate rates of doxorubicin-cell association (kf_ol) and rate of outward flippase/efflux activity (kflippase_out). (b) A representative model fit (solid lines) to data for the OVCAR8-Her2 cell line for 3, 15, and 75 µg/ml data (circles, squares, triangles, respectively). (c,d) Histograms of the fitted parameter values for kf_ol and kflippase_out, respectively.
Figure 3
Figure 3
Model training with literature data. (a,b) Doxorubicin and pharmacokinetic (PK) and tumor deposition data in mice were gathered from the literature (Supplementary References online), normalized to percent injected dose per ml and is shown in panels a and b (circles). Doxorubicin doses ranged from 0.5 to 20 mg/kg. In all studies, doxorubicin was quantified via high-performance liquid chromatography (HPLC). Tumor models included HepG2, Li-7, BT-474, 4T1, and NCI-N87. Similarly, tumor deposition data for conventional doxorubicin and pegylated liposomal doxorubicin (PLD) were extracted from the literature, normalized to percent injected dose/g of tumor tissue is shown in d and e (circles). Liposome data were restricted to pegylated liposomes, ~100 nm in diameter and containing doxorubicin. Liposome doses ranged from 3 to 20 mg/kg (equivalent doxorubicin dose). Xenograft models included BT-474, NCI-N87, KB, A375, B16F10, HepG2, Li-7, 4T1, and M190-FR (data not shown). Multiple detection methods were used for tracking liposomes: encapsulated doxorubicin (measured by HPLC) or radiolabeled lipids (3H, 67Ga, 111In, or 125I). The kinetic model from Figure 1 was fit to each set of data in panels a,b, d, and e (solid lines), as described in Methods section. Individual parameter estimates for doxorubicin (red) and PLD (blue) elimination from the central compartment (kel_dox and kel_lipo, respectively) are shown as a histogram in c. Individual parameter estimates for conventional doxorubicin (dashed lines) and PLD (solid lines) transvascular flux (tvf_in_dox and tvf_in_lipo respectively) from capillary to interstitial space in the tumor are shown as a histogram in f. (g) Human plasma PK data were compiled from the literature and as normalized to percent injected dose/ml (circles). Doxorubicin PK parameters (k12_dox, k21_dox, kel_dox) were fit to the data with the mean fit to the data shown in red. (h) Representative PLD plasma PK data from Harrington et al. is shown with the corresponding model fit, estimating kel_lipo, shown in red. A single data set is shown for clarity, due to the varying need for one vs. two-compartment models to describe human liposome PK. (i) The variability in estimated elimination rates for doxorubicin and PLD (kel_dox and kel_lipo), is shown. (j) A representative fit of the human model, fitting tvf_out_dox, to conventional doxorubicin tumor deposition data for 10 mg/m2 doxorubicin is shown from a patient with Kaposi sarcoma from the study of Northfelt et al. (k) A representative fit of the human model (fitting tvf_in_lipo) to PLD tumor deposition data is shown for a patient with breast cancer from the study of Harrington et al. treated with 111In-labeled PLD. (j,k) Representative fits for clarity of presentation, the PLD tumor deposition data are also shown in Supplementary Figure S1b online. (l) A summary of the variability of doxorubicin and PLD deposition parameters (tvf_in_dox and tvf_in_lipo) for human patients is shown. tvf_in_dox values were estimated from dynamic contrast enhanced-magnetic resonance imaging data in human tumors, as described in Results section. tvf_in_lipo values were estimated from patients with various tumor types from the study of Harrington et al. and Northfelt et al.,
Figure 4
Figure 4
A local sensitivity analysis of the mouse (top panel) and human (bottom panel) model was performed by varying each parameter by a small amount and calculating the relative change in the area under the curve of DNA-bound doxorubicin. Positive-sensitivity values indicate that an increase in that parameter would result in an increase in doxorubicin exposure at the tumor DNA, whereas negative values predict a decrease in exposure.
Figure 5
Figure 5
Relative delivery of doxorubicin for liposomal vs. conventional administration. (a) Mouse model simulations were performed for 3 mg/kg of conventional doxorubicin or pegylated liposomal doxorubicin (PLD) across a grid of tumor permeability values (tvf_in_dox and tvf_in_lipo). For each simulation, the area under the curve (AUC) of DNA bound in the tumor was determined over a 1 week period. The relative performance of conventional doxorubicin vs. PLD is plotted in the contours as log10(PLD AUC/conventional doxorubicin AUC). Positive values indicate increased doxorubicin delivery via PLD and negative values indicate increased exposure via conventional doxorubicin. Individual parameter estimates for tvf_in_dox and tvf_in_lipo determined from model training are plotted as circles and squares for reference. The plotted values outline a region of physiologically relevant parameter space (dashed rectangle). (b) The model was scaled to reflect human physiology and an analysis similar to that of the mouse was performed. Simulations of the human model were performed for 60 mg/m2 of conventional doxorubicin every 3 weeks or 50 mg/m2 of PLD every 4 weeks mimicking the clinical study of O'Brien, et al. across a grid of tumor permeability values (tvf_in_dox and tvf_in_lipo). The AUC of tumor bound doxorubicin over 3 weeks was calculated for each simulation and is plotted in the contours as log10(PLD AUC/conventional doxorubicin AUC). Estimates of tvf_in_dox values back-calculated from dynamic contrast enhanced-magnetic resonance imaging Ktrans values are plotted as circles and the estimates of tvf_in_lipo from solid tumors from Harrington et al. and Northfelt et al., are plotted as squares. tvf_in_lipo values for breast cancer and Kaposi sarcoma tumors are plotted as yellow and red stars, respectively. The dashed rectangle outlines a region of physiologically relevant parameter space. Note that a value of 1 on the contour indicates a 10-fold increase in total exposure.
Figure 6
Figure 6
Investigation of the effect of select model parameters on doxorubicin delivery. (a) Simulations of the human model were performed following a 40 mg/m2 dose of PLD while systematically varying both the tumor blood flow rate (Qtumor) and microvessel density (MVD) (MVD_tumor) 0.1–10x from their nominal value. The area under the curve of DNA-bound doxorubicin ((µg doxorubicin)/(g tumor)-min) was calculated and is plotted as a contour plot. (b) Simulations were performed as in a, except now varying parameters for liposome clearance (kel_lipo) and cellular uptake (ke_fluidphase) 0.1–10x from their nominal value. (c) Simulations were performed as in a except the release rates of drug from liposome (krel_plasma, krel_tumor, krel_cell) was systematically varied 0.01–100x from their nominal value. The relative values for the different release rates were fixed and all three parameters varied in concert.

Similar articles

Cited by

References

    1. Lefrak E.A., Pitha J., Rosenheim S., &, Gottlieb J.A. A clinicopathologic analysis of adriamycin cardiotoxicity. Cancer. 1973;32:302–314. - PubMed
    1. Von Hoff D.D.et al. Risk factors for doxorubicin-induced congestive heart failure Ann. Intern. Med 91710–717.1979 - PubMed
    1. O'Brien M.E.et al. Reduced cardiotoxicity and comparable efficacy in a phase III trial of pegylated liposomal doxorubicin HCl (Caelyx/Doxil) versus conventional doxorubicin for first-line treatment of metastatic breast cancer Ann. Oncol 15440–449.2004 - PubMed
    1. Colbern G.T., Hiller A.J., Musterer R.S., Pegg E., Henderson I.C., &, Working P.K. Significant increase in antitumor potency of doxorubicin Hc1 by its encapsulation in pegylated liposomes. J. Liposome Res. 1999;9:523.
    1. Hong R.L.et al. Direct comparison of liposomal doxorubicin with or without polyethylene glycol coating in C-26 tumor-bearing mice: is surface coating with polyethylene glycol beneficial Clin. Cancer Res 53645–3652.1999 - PubMed