. 2013 Jul 29;210(8):1635-46.
doi: 10.1084/jem.20121972. Epub 2013 Jul 8.

Apoptosis and dysfunction of blood dendritic cells in patients with falciparum and vivax malaria

Affiliations

Apoptosis and dysfunction of blood dendritic cells in patients with falciparum and vivax malaria

Alberto Pinzon-Charry et al. J Exp Med. .

Abstract

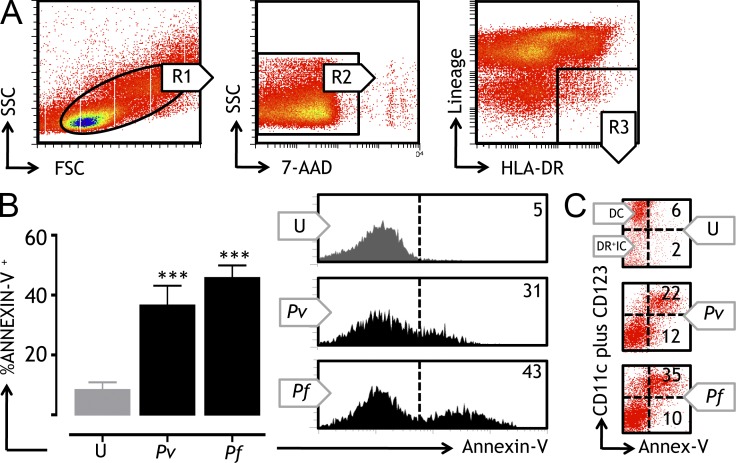
Malaria causes significant morbidity worldwide and a vaccine is urgently required. Plasmodium infection causes considerable immune dysregulation, and elicitation of vaccine immunity remains challenging. Given the central role of dendritic cells (DCs) in initiating immunity, understanding their biology during malaria will improve vaccination outcomes. Circulating DCs are particularly important, as they shape immune responses in vivo and reflect the functional status of other subpopulations. We performed cross-sectional and longitudinal assessments of the frequency, phenotype, and function of circulating DC in 67 Papuan adults during acute uncomplicated P. falciparum, P. vivax, and convalescent P. falciparum infections. We demonstrate that malaria patients display a significant reduction in circulating DC numbers and the concurrent accumulation of immature cells. Such alteration is associated with marked levels of spontaneous apoptosis and impairment in the ability of DC to mature, capture, and present antigens to T cells. Interestingly, sustained levels of plasma IL-10 were observed in patients with acute infection and were implicated in the induction of DC apoptosis. DC apoptosis was reversed upon IL-10 blockade, and DC function recovered when IL-10 levels returned to baseline by convalescence. Our data provide key information on the mechanisms behind DC suppression during malaria and will assist in developing strategies to better harness DC's immunotherapeutic potential.


Figures

Figure 1.
Figure 1.
Altered blood DC subset distribution in malaria patients. (A) Peripheral blood DCs were identified as LinHLA-DR+ cells and analyzed for the expression of CD11c (y axis) and CD123 (x axis) by flow cytometry. The gating strategy for mDC, pDC, and a minor population of HLA-DR+ immature cells (DR+IC) is shown. Representative dot plots of the blood DC subset distribution in uninfected control and Pf or Pv patients are shown. Numbers indicate the percentage of cells within each gate. (B) Blood leukocyte counts including lymphocyte, monocyte, neutrophil, mDC, pDC, and DR+IC were estimated in a cohort of 45 patients with malaria (Pv, n = 19; Pf, n = 26) and compared with uninfected controls (U, n = 12). Absolute mDC, pDC, and DR+IC counts are expressed as 106/liter and all other counts are expressed as 109/liter. Box plots include means, standard deviations, and ranges. Significant differences compared with uninfected controls are indicated as ***, P < 0.001.
Figure 2.
Figure 2.
Altered mDC subset distribution in malaria patients. (A) mDCs (mDC, CD11c+ CD123+) were analyzed by flow cytometry for expression of CD141, CD1c, and CD16. DCs were gated as shown, and the populations were enumerated in the blood of 12 patients with malaria (Pv, n = 6; Pf, n = 6) and uninfected controls (U, n = 5). Data are expressed as cells/µl. Box plots include means, standard deviations, and ranges. Significant differences compared with uninfected controls are indicated as *, P < 0.05. (B) In a cohort of Pv (n = 5) and uninfected (n = 5) individuals, lineage-positive HLA-DR+ cells were analyzed for expression of CD11c and CD123 (DC), CD79a (B-cells), and CD11b (monocytes). Representative FACS plot from one Pv patient shown.
Figure 3.
Figure 3.
Spontaneous apoptosis of blood DC in malaria patients. Blood DC from patients with malaria (Pv, n = 19; Pf, n = 26) and uninfected matched controls (U, n = 12) were analyzed for apoptosis by flow cytometry. (A) Cells were gated on viable mononuclear cells (R1), which were further gated on 7-AAD–negative cells (R2). Blood DCs were identified as LinHLA-DR+ cells (R3). Representative dot plots are shown. (B) Apoptosis in blood DC from uninfected donors (gray) and patients with malaria (black) was determined using Annexin-V binding assays. In all experiments, each patient was tested in parallel with at least one uninfected donor. Representative histograms and summary of apoptosis data (mean ± SEM) are shown. (C) DC (mDC plus pDC) and DR+IC in uninfected donors and malaria patients were evaluated for apoptosis by Annexin-V staining. Numbers indicate the percentage of cells that are positive for Annexin-V. Statistically significant differences between uninfected controls and patients are shown. ***, P < 0.001.
Figure 4.
Figure 4.
Impaired phenotype, antigen uptake, and stimulatory capacity in DC from malaria patients. (A) Expression of the costimulatory molecules CD83, CD86, and HLA-DR was analyzed on blood DC in a cohort of 45 patients with malaria (Pv, n = 19; Pf, n = 26) compared with uninfected controls (U, n = 12) directly ex vivo (gray histograms) or after overnight incubation (black histograms) without exogenous cytokines. Representative histograms are shown. (B) Summary of phenotypic analysis (mean ± SEM) for each antigen expressed as ΔMFI (y axis) between cultured and fresh samples. (C) Blood DCs from uninfected donors (U, n = 12) or patients with malaria (Pv, n = 19; Pf, n = 26) were incubated with FITC-dextran at 4°C (gray) or 37°C (black), and uptake was measured by flow cytometry. Graph shows summary of antigen uptake data (mean ± SEM) presented as ΔMFI (y axis) between test and control for all patients. (D) Blood DC from patients (Pf, n = 5; Pv, n = 5) and uninfected volunteers (U, n = 5) was tested against allogeneic CD4 T cells from a panel of healthy Australian donors (n = 5). CD4 T cells and blood DCs were co-cultured at a 30:1 T/DC ratio. Cells were harvested after 96 h of culture and CD4 T cell proliferation estimated by CFSE dilution. Bars indicate the percentage of CFSEdim CD4 T cells for each stimulatory condition. In all experiments, each patient was tested in parallel with at least one uninfected donor. Results are representative of five separate experiments performed. Statistically significant differences compared with uninfected controls are indicated. *, P < 0.05; ***, P < 0.001.
Figure 5.
Figure 5.
Profile of cytokines in plasma of patients with malaria. (A) The indicated plasma cytokines were measured by CBA assay in samples from Pf patients (n = 10) at days 0 (D0), 7 (D7), and 28 (D28) after antimalarial drug treatment and compared with patients with acute Pv (n = 19) or uninfected donors (U, n = 12). Summary of cytokine levels are presented as mean ± SEM for each cytokine. Significant differences compared with uninfected controls are indicated as *, P < 0.05; **, P < 0.01; and ***, P < 0.001. (B) Correlation between the percentage of blood DC undergoing apoptosis (x axis) and cytokine levels for IL-6, TNF, and IL-10 (y axis) in 45 patients with acute malaria (Pf, n = 26 and Pv, n = 19). Spearman’s Rank Test, R = 0.60, P < 0.0001 for IL-10; R = −0.14, P = 0.35 for IL-6; and R = −0.07, P = 0.6 for TNF.
Figure 6.
Figure 6.
IL-10 induces apoptosis of maturing blood DC. (A) Blood DCs from healthy Australian donors (n = 5) were induced to mature by 24 h incubation with LPS and subsequently exposed to either 500 pg/ml of exogenous recombinant human IL-10 (LPS + IL-10) or 50% (vol/vol) plasma samples from uninfected volunteers containing low levels of IL-10 (n = 3, mean 58.6 pg/ml, U Plasma) or high levels of IL-10 from Pf (n = 3; mean 602.6 pg/ml, Pf plasma) or Pv (n = 3; mean 353.8 pg/ml, Pv plasma) patients with or without anti–IL-10R antibodies. Representative histograms from three donors are shown. Numbers indicate the percentage of apoptotic (Annexin-V+) blood DC in each culture. Results are representative of three separate experiments. (B) Graph shows summary data of all donors. Statistically significant differences between samples exposed to blocking (anti–IL-10R) and nonblocking (Isotype) antibodies as well as between U plasma and Pf or Pv plasma are indicated. Error bars show SEM. *, P < 0.05; ****, P < 0.0001.
Figure 7.
Figure 7.
Reversal of DC dysfunction after antimalarial treatment. (A and B) Blood DCs were analyzed during acute Pf malaria at day 0 (D0) and also at days 7 (D7) and 28 (D28) after antimalarial treatment in a cohort of 10 patients and compared with uninfected volunteers (U, n = 12). In all experiments, each patient was tested in parallel with at least one uninfected volunteer. The blood DC compartment was analyzed for absolute counts of mDC, pDC, and DR+IC (106/liter; A) and blood DC subset distribution. (B) Representative dot plots of one uninfected control as well as one patient assessed at days 0 (D0), 7 (D7), and 28 (D28) are shown. Values indicate percentage of cells within respective gates. (C) Summary of blood DC apoptosis data (mean ± SEM). (D) Summary of antigen uptake (FITC-Dextran) data assessed as the difference between uptake at 37°C (test) or 4°C (control) expressed as ΔMFI (mean ± SEM). (E) Representative histograms of apoptosis from one patient at days 0 (D0), 7 (D7), and 28 (D28) compared with one uninfected control. Values indicate percentage of Annexin-V–positive cells. (F) Summary of phenotypic maturation estimated by up-regulation in expression of CD83, CD86, and HLA-DR expressed as ΔMFI (mean ± SEM). (G) Representative histograms of antigen uptake from one patient at days 0 (D0), 7 (D7), and 28 (D28) compared with one uninfected control. Gray histograms indicate uptake at 4°C (control) and black histograms represent uptake at 37°C (test). Values indicate uptake as ΔMFI between cultured and fresh samples. Statistically significant differences compared with uninfected volunteers are indicated as *, P < 0.05; **, P < 0.01; and ***, P < 0.001.
Figure 8.
Figure 8.
Recovery of DC allostimulatory capacity after antimalarial treatment. (A) Naive allogeneic CD4 T cells purified from a panel of healthy Australian donors (n = 5) were co-cultured with blood DC from malaria patients at day 0, 7, or 28 (n = 8) or uninfected controls at a 30:1 T/DC ratio (n = 12). Cells were harvested after 96 h of culture and CD4 T cell proliferation estimated by CFSE dilution (x axis). Representative histograms are shown with numbers indicating the percentage of CFSEdim CD4 T cells for each stimulatory condition. The representative pairs giving maximal responses for three different T cell donors are shown. In all experiments, each patient was tested in parallel with at least one uninfected volunteer. (B) Supernatants from cultures in A were harvested after 72 h and levels of IL-2, TNF, IFN-γ, IL-6, IL-4, and IL-10 estimated using CBA assay by FACS. Box plots include means, standard deviations, and ranges. Significant differences compared with uninfected controls are indicated as *, P < 0.05. Results are representative of five separate experiments performed.

References

    1. Aldebert D., Diallo M., Niang M., Sarr D., Cisse C., Moreau J.C., Jambou R. 2007. Differences in circulating dendritic cell subtypes in peripheral, placental and cord blood in African pregnant women. J. Reprod. Immunol. 73:11–19 10.1016/j.jri.2006.05.002 - DOI - PubMed
    1. Arama C., Giusti P., Boström S., Dara V., Traore B., Dolo A., Doumbo O., Varani S., Troye-Blomberg M. 2011. Interethnic differences in antigen-presenting cell activation and TLR responses in Malian children during Plasmodium falciparum malaria. PLoS ONE. 6:e18319 10.1371/journal.pone.0018319 - DOI - PMC - PubMed
    1. Banchereau J., Briere F., Caux C., Davoust J., Lebecque S., Liu Y.J., Pulendran B., Palucka K. 2000. Immunobiology of dendritic cells. Annu. Rev. Immunol. 18:767–811 10.1146/annurev.immunol.18.1.767 - DOI - PubMed
    1. Bettiol E., Carapau D., Galan-Rodriguez C., Ocaña-Morgner C., Rodriguez A. 2010. Dual effect of Plasmodium-infected erythrocytes on dendritic cell maturation. Malar. J. 9:64 10.1186/1475-2875-9-64 - DOI - PMC - PubMed
    1. Bhattarai A., Ali A.S., Kachur S.P., Mårtensson A., Abbas A.K., Khatib R., Al-Mafazy A.W., Ramsan M., Rotllant G., Gerstenmaier J.F., et al. 2007. Impact of artemisinin-based combination therapy and insecticide-treated nets on malaria burden in Zanzibar. PLoS Med. 4:e309 10.1371/journal.pmed.0040309 - DOI - PMC - PubMed

Publication types

MeSH terms