

doi: 10.1038/psp.2012.4.
Basic concepts in population modeling, simulation, and model-based drug development
Affiliations
- PMID: 23835886
- PMCID: PMC3606044
- DOI: 10.1038/psp.2012.4
Item in Clipboard
Basic concepts in population modeling, simulation, and model-based drug development
CPT Pharmacometrics Syst Pharmacol.
.
Abstract
Modeling is an important tool in drug development; population modeling is a complex process requiring robust underlying procedures for ensuring clean data, appropriate computing platforms, adequate resources, and effective communication. Although requiring an investment in resources, it can save time and money by providing a platform for integrating all information gathered on new therapeutic agents. This article provides a brief overview of aspects of modeling and simulation as applied to many areas in drug development.CPT: Pharmacometrics & Systems Pharmacology (2012) 1, e6; doi:10.1038/psp.2012.4; advance online publication 26 September 2012.
Figures
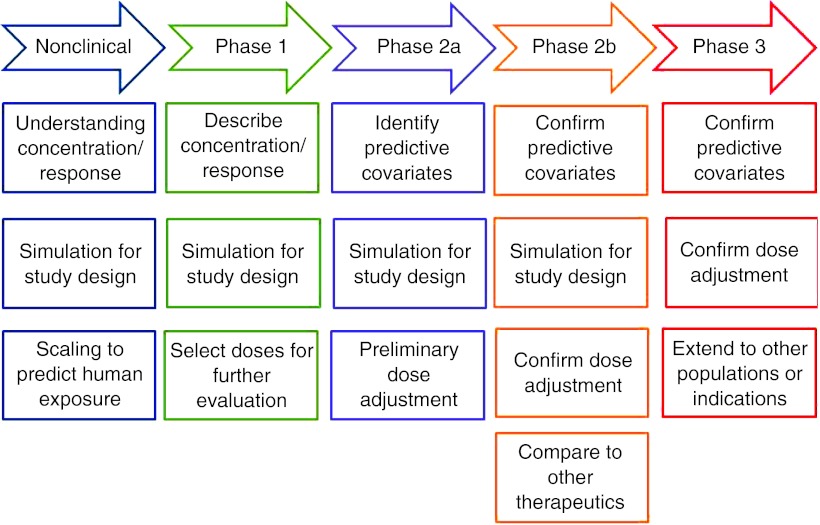
Modeling and simulation during drug development.
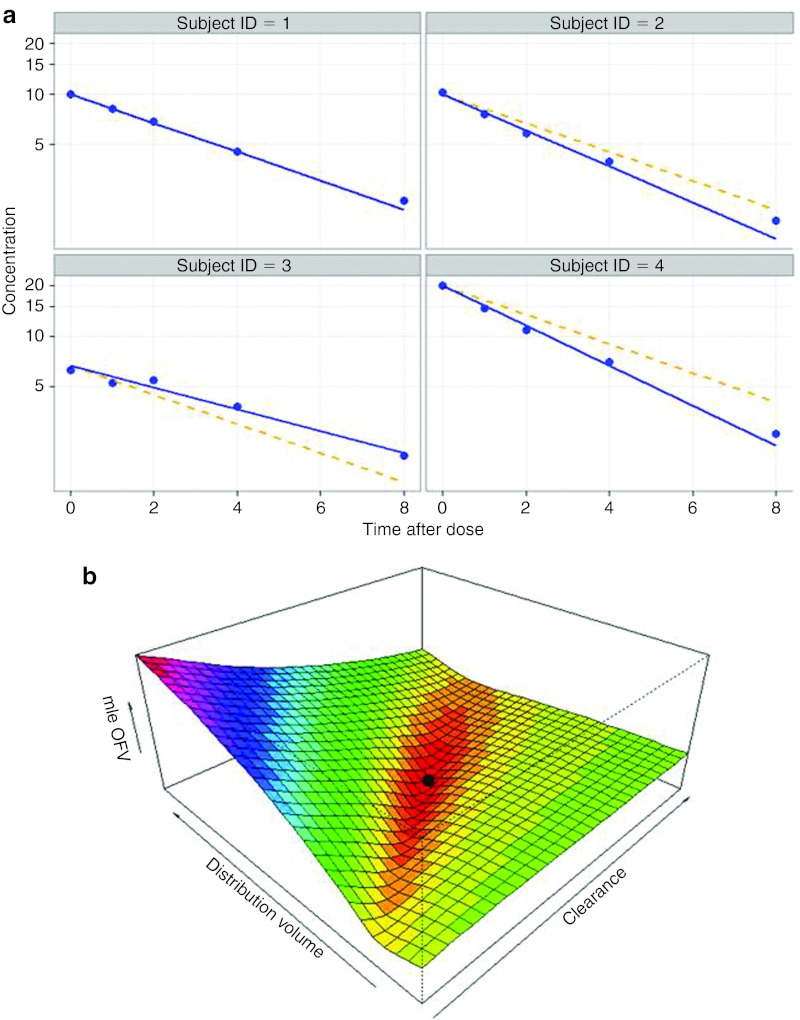
Best fit for a simple population pharmacokinetics model. (a) Goodness-of-fit plots for the model shown in Table 1. Symbols represent the observed data. The solid blue line denotes individual predicted concentration (CIPRED). The broken line denotes the population predicted concentration (CPRED). CPRED accounts for the explainable between-subject differences (e.g., dose and covariates). CIPRED accounts for both explainable and unexplainable differences (e.g., BSV in CL) between subjects. (b) When only two parameters are fitted (CLPOP and VPOP in this case) the OFV is a three-dimensional surface. The best fit parameters are shown by the black symbol in the “trough” in the objective function value (OFV) surface.
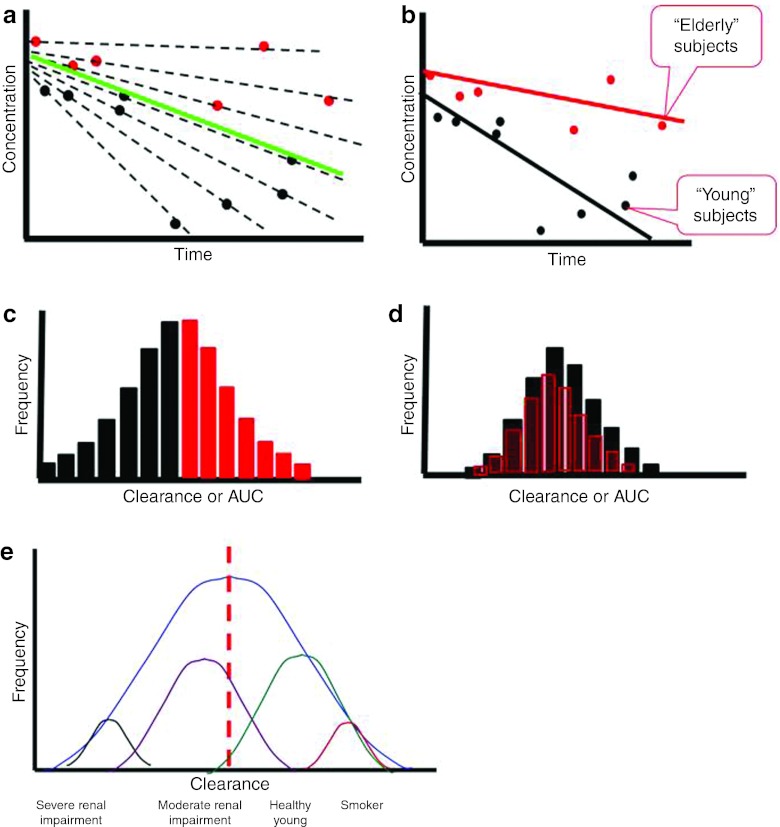
Effect of covariates on variability. (a) Plot of concentrations vs. time. The solid green line denotes population average, the broken black lines denote individual averages, the red symbols represent concentration values in elderly subjects, and the black symbols represent concentration values in young subjects. (b) The solid red line denotes the population average for elderly subjects, and the solid black line represents the population average for young subjects. (c) Frequency histogram of exposures (area under the curve (AUC)) or clearances across the entire population. (d) Frequency histogram of exposures or clearances after adjusting for age. (e) A representative distribution of clearance values with underlying distributions being associated with patient factors and covariates.
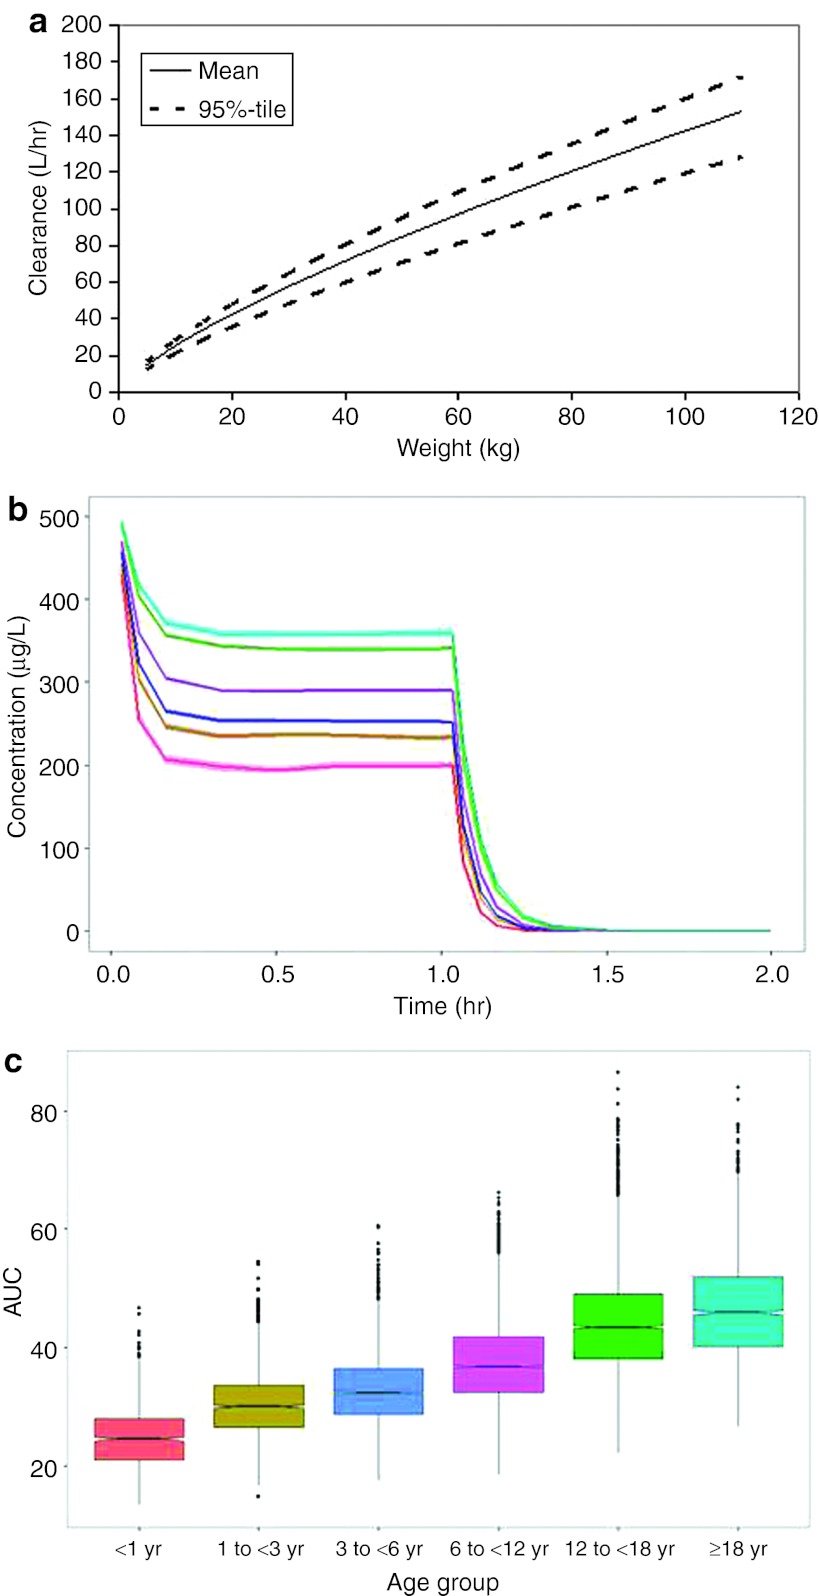
Simulated exposures for different age groups. (a) Relationship between clearance and weight. The solid line denotes the mean relationship, and the upper and lower broken lines denote the upper and lower 95% confidence intervals, respectively. (b) Simulation of mean concentration–time profiles after a 1-h infusion of a 10 mg/kg dose to neonates (pink line), infants (brown line), young children (blue line), older children (purple line), adolescents (green line), and adults (cyan line). (c) Box and whisker plots of simulated (area under the curve (AUC)) values for neonates (pink), infants (brown), young children (blue), older children (purple), adolescents (green), and adults (cyan) after the 10 mg/kg dose regimen.
References
-
- Atkinson A.J., Jr, &, Lalonde R.L. Introduction of quantitative methods in pharmacology and clinical pharmacology: a historical overview. Clin. Pharmacol. Ther. 2007;82:3–6. - PubMed
-
- Sheiner L.B., Rosenberg B., &, Melmon K.L. Modelling of individual pharmacokinetics for computer-aided drug dosage. Comput. Biomed. Res. 1972;5:411–459. - PubMed
-
- Sheiner L.B., &, Beal S.L. Evaluation of methods for estimating population pharmacokinetics parameters. I. Michaelis-Menten model: routine clinical pharmacokinetic data. J. Pharmacokinet. Biopharm. 1980;8:553–571. - PubMed
-
- Stanski D.R., &, Maitre P.O. Population pharmacokinetics and pharmacodynamics of thiopental: the effect of age revisited. Anesthesiology. 1990;72:412–422. - PubMed
-
- Sheiner L.B. The population approach to pharmacokinetic data analysis: rationale and standard data analysis methods. Drug Metab. Rev. 1984;15:153–171. - PubMed
LinkOut - more resources
Full Text Sources
Other Literature Sources
Miscellaneous
