. 2013 Mar 27;2(3):e35.
doi: 10.1038/psp.2013.11.

Metasignatures identify two major subtypes of breast cancer

Affiliations

Metasignatures identify two major subtypes of breast cancer

Q Duan et al. CPT Pharmacometrics Syst Pharmacol. .

Abstract

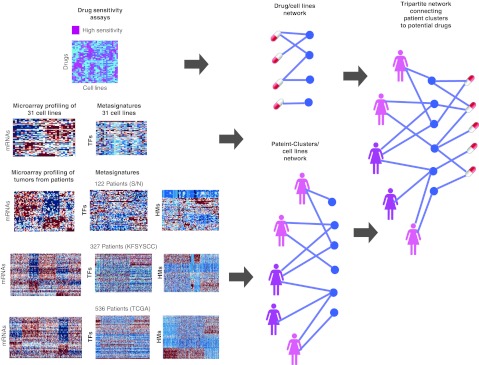
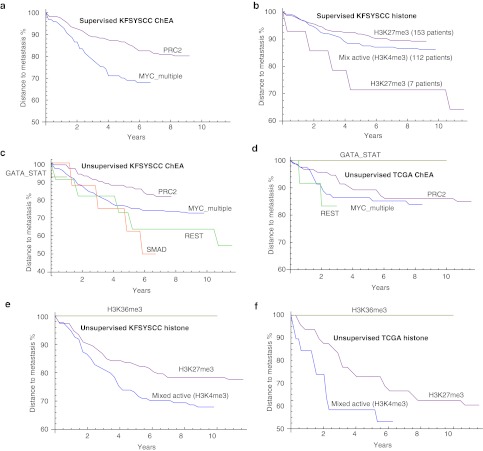
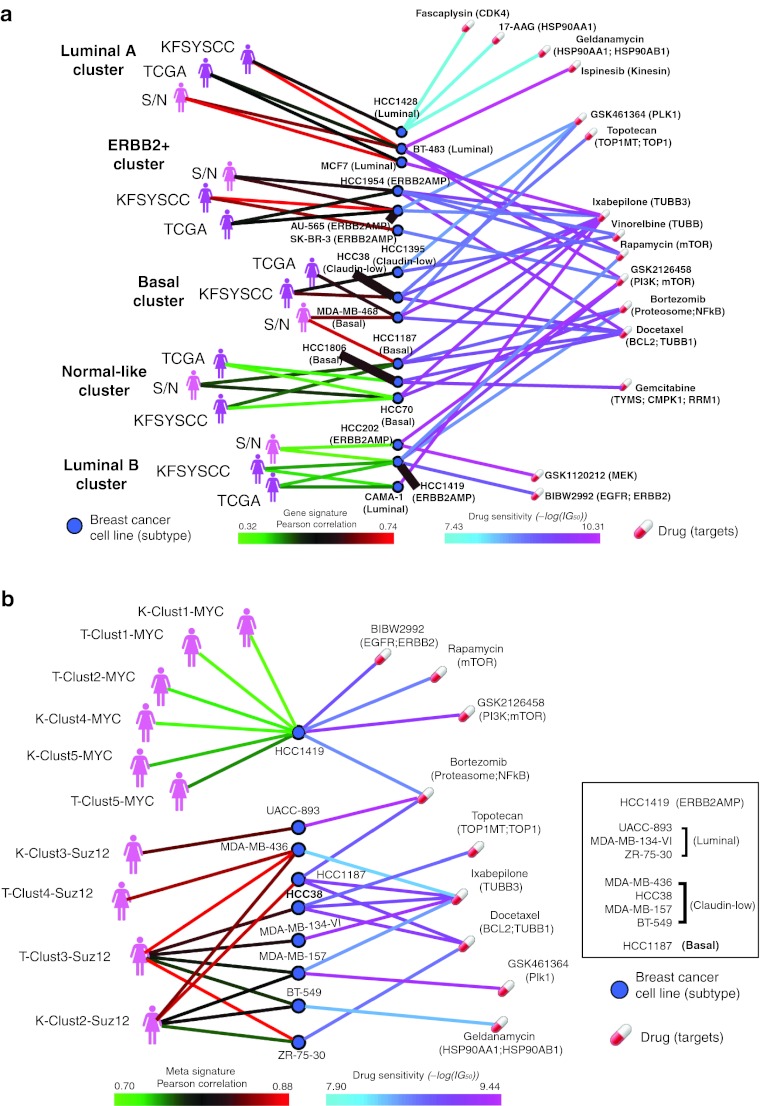
Genome-wide expression data from tumors and cell lines in breast cancer, together with drug response of cell lines, open prospects for integrative analyses that can lead to better personalized therapy. Drug responses and expression data collected from cell lines and tumors were used to generate tripartite networks connecting clusters of patients to cell lines and cell lines to drugs, to connect drugs to patients. Various approaches were applied to connect cell lines to tumor clusters: a standard method that uses a biomarker gene set, and new methods that compute metasignatures for transcription factors and histone modifications given upregulated genes in cell lines or tumors. The results from the metasignature analysis identify two major clusters of patients: one enriched for active histone marks and one for repressive marks. The tumors enriched for activation marks are correlated with poor prognosis. Overall, the analyses suggest new patient clustering, discover dysregulated pathways, and recommend individualized use of drugs to treat subsets of patients.CPT: Pharmacometrics & Systems Pharmacology (2013) 2, e35; doi:10.1038/psp.2013.11; advance online publication 27 March 2013.


Figures

Figure 1
Figure 1
Schematic of the pipeline for the generation of integrated tripartite networks of patient clusters, cell lines, and drugs. Drug/cell-line correlation matrix was integrated with gene expression or metasignatures matrices from cell lines and from three studies that profiled gene expression in tumors from patients. From each expression or metasignature matrix, clusters of patients were identified and mapped to individual cell lines, whereas cell lines were connected to the drugs that show most potency in inhibiting their proliferation. KFSYSCC, Koo foundation Sun-Yat-Sen Cancer Center; TCGA, The Cancer Genome Atlas. S/N, Stanford/Norway.
Figure 2
Figure 2
Connecting cell lines to clusters of patients. (a) Correlation of coexpressed patient tumor clusters and cell lines using the biomarker gene set or (b) the supervised metasignature approach applied using the histone modification gene-set library. KFSYSCC, Koo foundation Sun-Yat-Sen Cancer Center; TCGA, The Cancer Genome Atlas.
Figure 3
Figure 3
Unsupervised metasignature clustering of The Cancer Genome Atlas patients using the (a) ChEA or (b) histone modifications gene-set libraries. Patients are colored based on the classifications determined by the supervised mRNA approach according to their classified subtype using the 52 biomarker gene set.
Figure 4
Figure 4
Kaplan–Meier survival curves applied to the identified clusters using the metasignature supervised and unsupervised methods. (a) The two major clusters identified using the ChEA metasignatures in the KFSYSCC data set. (b) The two major clusters identified using the histone modification metasignatures in the KFSYSCC data set, as well as a smaller cluster of seven patients. (c–f) Survival curves for the unsupervised clustering applied to the TCGA and KFSYSCC data sets. The major clusters are the lines with the more refined fluctuations. These clusters correspond to clusters shown in Figure 3 and Supplementary Figures S1–S6 online. KFSYSCC, Koo foundation Sun-Yat-Sen Cancer Center; TCGA, The Cancer Genome Atlas.
Figure 5
Figure 5
Network that integrates gene expression and drug–response data to connect groups of patients, cell lines, and drugs. Edges between patient groups and cell lines are colored based on higher (red) or lower (green) expression correlation. Edges between cell lines and drugs are colored based on higher (magenta/purple) to lower (cyan) drug sensitivity. (a) On the basis of supervised mRNA expression; (b) On the basis of metasignature applied using the ChEA gene-set library. KFSYSCC, Koo foundation Sun-Yat-Sen Cancer Center; S/N, Stanford/Norway; TCGA, The Cancer Genome Atlas.

References

    1. Korde L.A., et al. Gene expression pathway analysis to predict response to neoadjuvant docetaxel and capecitabine for breast cancer. Breast Cancer Res. Treat. 2010;119:685–699. - PMC - PubMed
    1. Cancer Genome Atlas Network. Comprehensive molecular portraits of human breast tumours. Nature. 2012;490:61–70. - PMC - PubMed
    1. Stephens P.J., Oslo Breast Cancer Consortium (OSBREAC) et al. The landscape of cancer genes and mutational processes in breast cancer. Nature. 2012;486:400–404. - PMC - PubMed
    1. Gray J., Druker B. Genomics: the breast cancer landscape. Nature. 2012;486:328–329. - PubMed
    1. Perou C.M., et al. Molecular portraits of human breast tumours. Nature. 2000;406:747–752. - PubMed