Comparative Study
. 2013 Aug 15;122(7):1293-304.
doi: 10.1182/blood-2013-05-501072. Epub 2013 Jul 8.

Personalized synthetic lethality induced by targeting RAD52 in leukemias identified by gene mutation and expression profile

Affiliations
Comparative Study

Personalized synthetic lethality induced by targeting RAD52 in leukemias identified by gene mutation and expression profile

Kimberly Cramer-Morales et al. Blood. .

Abstract

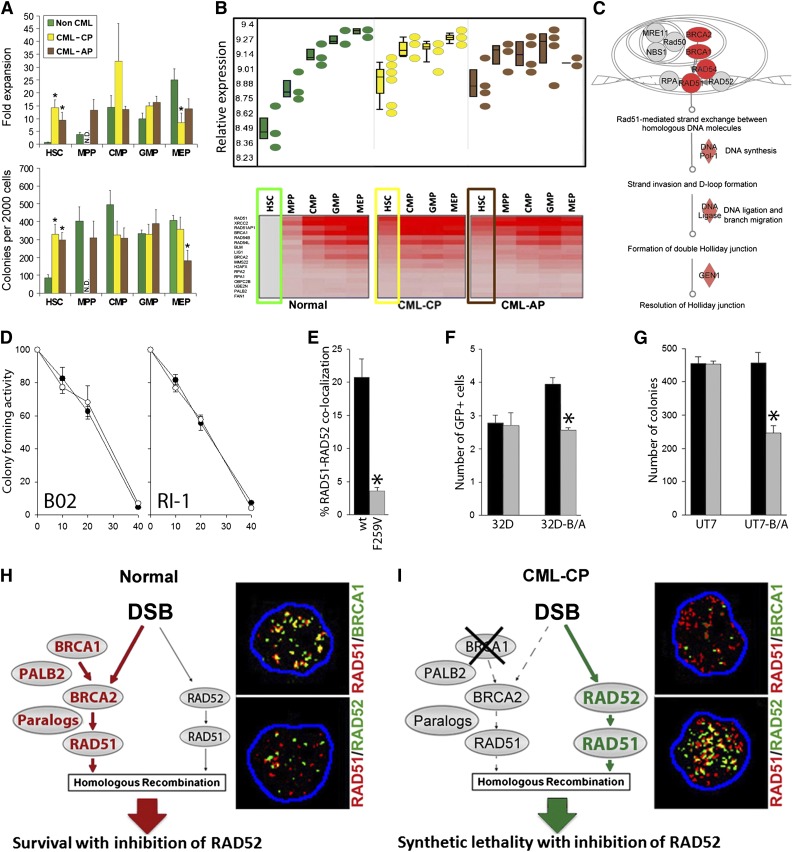
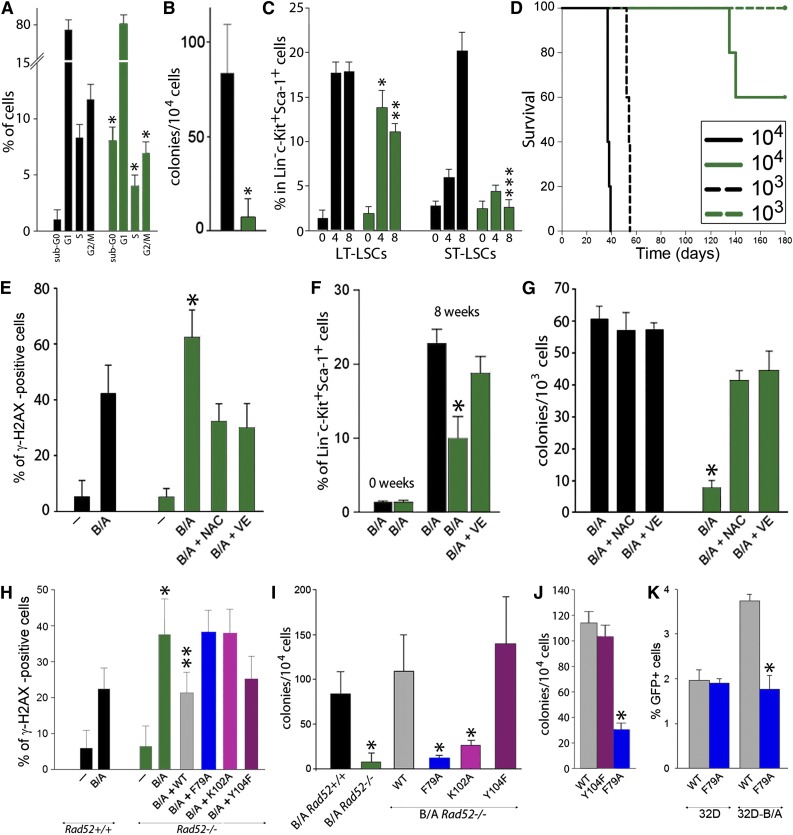
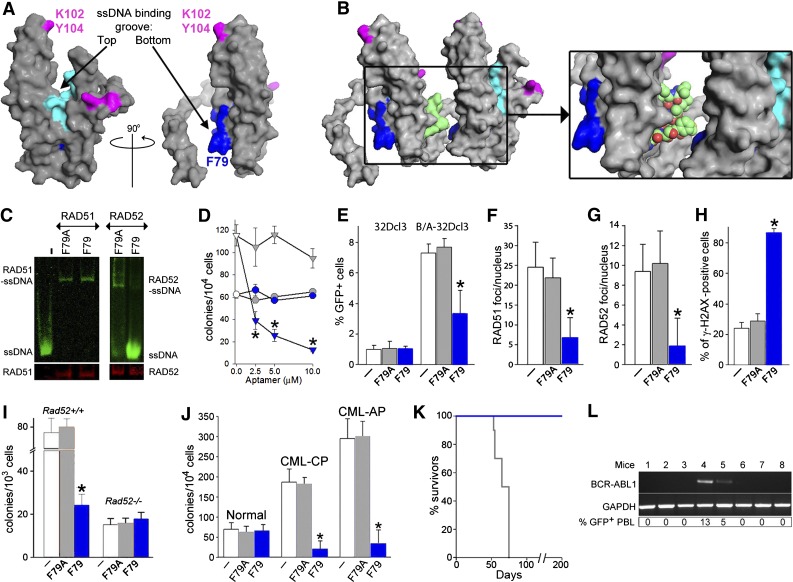
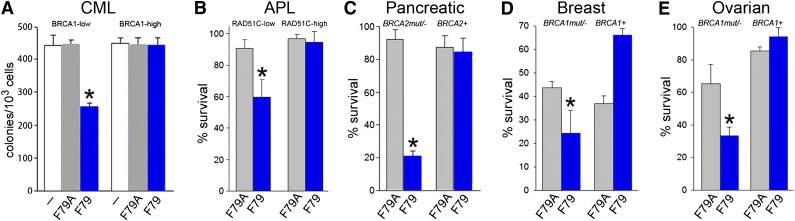
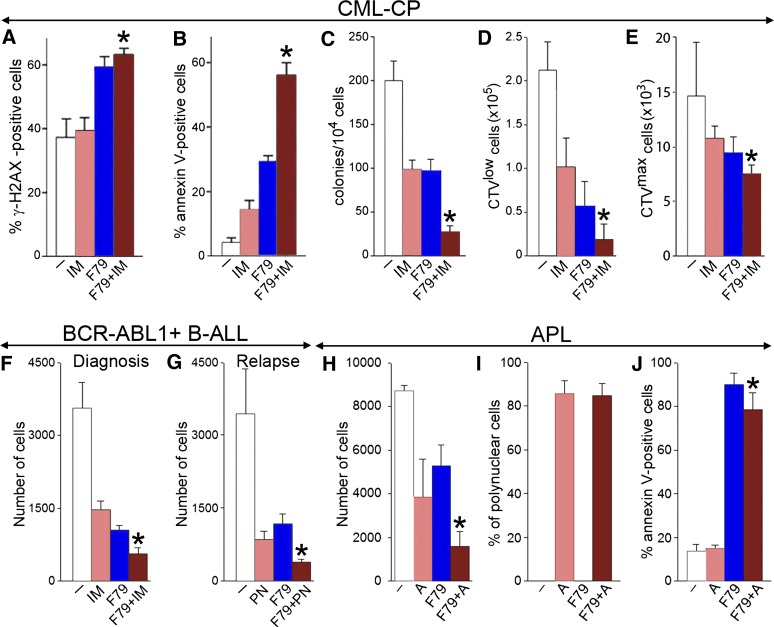
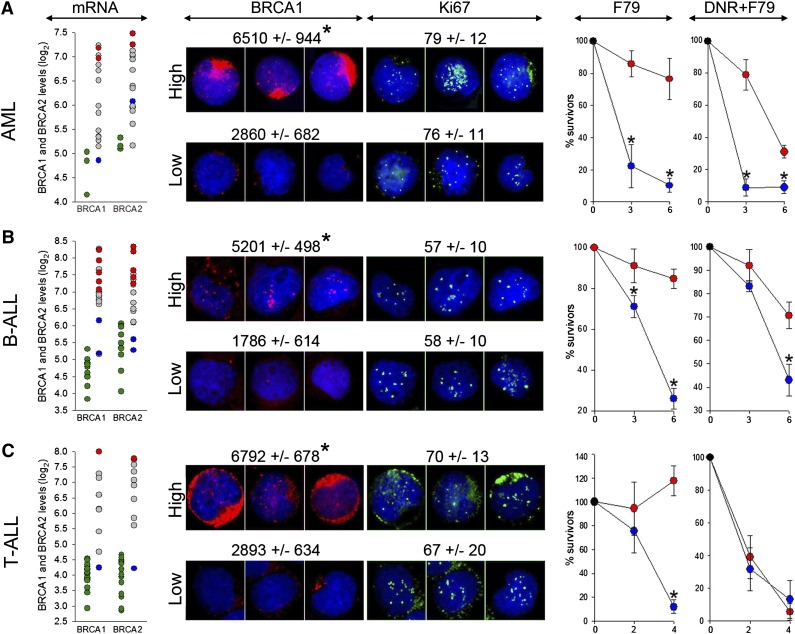
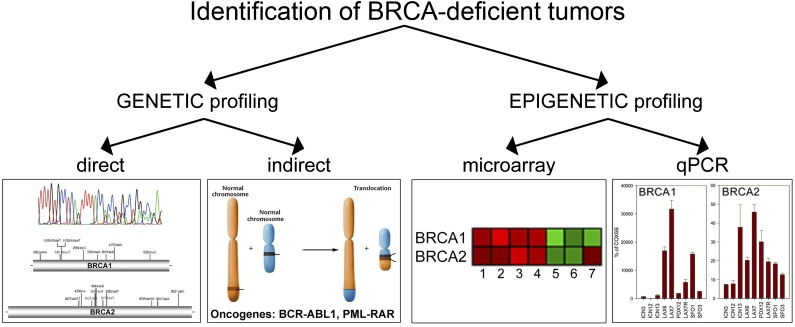
Homologous recombination repair (HRR) protects cells from the lethal effect of spontaneous and therapy-induced DNA double-stand breaks. HRR usually depends on BRCA1/2-RAD51, and RAD52-RAD51 serves as back-up. To target HRR in tumor cells, a phenomenon called "synthetic lethality" was applied, which relies on the addiction of cancer cells to a single DNA repair pathway, whereas normal cells operate 2 or more mechanisms. Using mutagenesis and a peptide aptamer approach, we pinpointed phenylalanine 79 in RAD52 DNA binding domain I (RAD52-phenylalanine 79 [F79]) as a valid target to induce synthetic lethality in BRCA1- and/or BRCA2-deficient leukemias and carcinomas without affecting normal cells and tissues. Targeting RAD52-F79 disrupts the RAD52-DNA interaction, resulting in the accumulation of toxic DNA double-stand breaks in malignant cells, but not in normal counterparts. In addition, abrogation of RAD52-DNA interaction enhanced the antileukemia effect of already-approved drugs. BRCA-deficient status predisposing to RAD52-dependent synthetic lethality could be predicted by genetic abnormalities such as oncogenes BCR-ABL1 and PML-RAR, mutations in BRCA1 and/or BRCA2 genes, and gene expression profiles identifying leukemias displaying low levels of BRCA1 and/or BRCA2. We believe this work may initiate a personalized therapeutic approach in numerous patients with tumors displaying encoded and functional BRCA deficiency.


Figures

Figure 1
Figure 1
The concept of RAD52-dependent synthetic lethality in proliferating LSCs/LPCs. (A, upper) Fold over baseline expansion of different stem and progenitor cell subpopulations from 3 normal, 6 CML-CP, and 4 CML-AP samples during a 5-day culture; (lower) number of colonies from different stem and progenitor cell subpopulations; *P < .05 in comparison with normal counterparts. N.D., not determined. (B, upper) Differential expression of genes involved in HRR in stem and progenitor populations in CML-CP and CML-AP patients, and normal donors identified by gene ontology ANOVA; (lower) heat map of HRR genes upregulated in LSCs and LPCs compared with normal HSCs. Results from HSCs and LSCs are highlighted in boxes. (C) Ingenuity pathway analysis identifies HRR as a key upregulated pathway in LSCs. (D) Percentage of the remaining colony-forming activity of LinCD34+ bone marrow cells from 3 healthy donors (○) and 3 CML-CP patients (●) treated with indicated micromol concentrations of B02 and RI-1. (E) Percentage of Flag-RAD51(WT) and Flag-RAD51(F259V) foci colocalizing with endogenous RAD52 in 10 cells/group; *P < .001. (F) Number of GFP+ cells representing HRR activity in parental 32Dcl3 (32D) and BCR-ABL1-positive 32Dcl3 (32D-B/A) cells expressing Flag-RAD51(WT) (black bars) and Flag-RAD51(F259V) (gray bars); *P = .003. (G) Number of colonies from parental UT7 and BCR-ABL1-positive UT7 (UT7-B/A) cells expressing Flag-RAD51(WT) (black bars) and Flag-RAD51(F259V) (gray bars); *P < .001. (H-I) RAD52-dependent synthetic lethality. (H) HSCs/HPCs usually employ the BRCA1/BRCA2/PALB2-RAD51 pathway to repair a DSB, whereas the RAD52-RAD51 axis forms an alternative mechanism. Thus, RAD51 foci often colocalize with BRCA1, but not RAD52 foci. (I) The downregulation of BRCA1 protein in CML-CP LSCs/LPCs forces them to use the RAD52-RAD51 pathway. In concordance, RAD51 nuclear foci often colocalize with RAD52, but not BRCA1. Twenty-five cells per group were analyzed; representative nuclear foci are shown (yellow color indicates colocalization).
Figure 2
Figure 2
RAD52 DNA binding plays a critical role in BCR-ABL1-mediated leukemogenesis by preventing the accumulation of ROS-induced lethal DSBs. (A-D) BCR-ABL1 Rad52+/+ (black bars) and BCR-ABL1 Rad52−/− (green bars) murine bone marrow cells were analyzed for (A) cell cycle progression (*P < .05 in comparison with corresponding +/+ cells); (B) clonogenic activity (*P = .008); (C) frequency of long-term leukemia stem cells (LT-LSCs) and short-term leukemia stem cells (ST-LSCs) at 0, 4, and 8 weeks after BCR-ABL1 expression (*P = .04; **P = .001; ***P < .001 in comparison with the corresponding +/+ subpopulation); and (D) leukemia induction in SCID mice (5-6 mice/group). (E-G) BCR-ABL1-positive (B/A) and nontransfected (−) Rad52−/− cells (green bars) and Rad52+/+ counterparts (black bars) were incubated with N-acetyl-cysteine (NAC) and vitamin E (VE) when indicated. (E) Percentage of Linc-Kit+Sca-1+ cells with more than 20 γ-H2AX foci; *P < .01 in comparison with B/A-positive Rad52+/+ and B/A+NAC and B/A+VE Rad52−/− counterparts. (F) Percentage of LSCs cells at 0 and 8 weeks posttransfection; *P < .05 in comparison with other groups at 8 weeks. (G) Clonogenic activity of LSCs; P < .001 in comparison with NAC and VE-treated cells. (H-I) B/A Rad52+/+ cells and B/A Rad52−/− cells transfected with RAD52(WT), RAD52(F79A), RAD52(K102A), and RAD52(Y104F). (H) Percentage of cells with more than 20 γ-H2AX foci; *P < .05 in comparison with B/A Rad52+/+ cells; **P < .05 in comparison with B/A, B/A+F79A and B/A+K102A Rad52−/− cells. (I) Number of clonogenic cells; P < .02 in comparison with B/A Rad52+/+ cells. (J) Number of LinCD34+ CML-CP clonogenic cells expressing RAD52(WT), RAD52(F79A), and RAD52(Y104F); *P < .001 in comparison with WT. (K) Number of GFP+ cells representing HRR activity in parental 32Dcl3 (32D) and 32D-B/A cells expressing RAD52(WT) and RAD52(F79A) mutant; *P < .001 in comparison with 32D-B/A WT.
Figure 3
Figure 3
F79 aptamer disrupts RAD52-ssDNA binding and inhibits HRR to elevate the number of lethal DSBs and eradicate CML. (A) Surface views of the RAD52(1-212) protomer; the top and the bottom of the ssDNA binding groove are marked with arrows. Amino acids forming the ssDNA binding groove (DNA I) are colored in light/dark blue and these binding to dsDNA (DNA II) are in magenta. The location of amino acids V71-G83, which form the F79 aptamer, is highlighted in dark blue. All structures were created using the PyMOL program. (B) The F79 aptamer surface (light green) is shown between 2 RAD52 monomers to illustrate the size of the aptamer and demonstrate that it is a better fit to the binding groove than the other RAD52 monomer. The zoomed box focuses on the area that the aptamer occupies between the 2 RAD52 monomers. (C) F79 and F79A aptamers were added to the mixture of IRDye800-ssDNA and GST-RAD52 protein (right) or IRDye800-ssDNA and GST-RAD51 protein (left); the presence of ssDNA-RAD52 and ssDNA-RAD51 complexes were detected by agarose fluorescent gel shift assay (upper) combined with western blotting (lower). (D) Number of colonies from normal and CML-CP LinCD34+ cells (circles and triangles, respectively) incubated with the indicated concentrations of F79A (gray) and F79 (blue) aptamer; *P < .001 in comparison with F79A. (E-H) Cells were untreated (white bars) or treated with F79A (gray bars) and F79 (blue bars) aptamer. (E) Percentage of GFP+ cells representing HRR activity in 32Dcl3 and BCR-ABL1 (B/A)-32Dcl3 cells; *P = .01. (F) Number of RAD51 foci/nucleus in LinCD34+ CML-CP; *P < .001. (G) Number of RAD52 foci/nucleus in LinCD34+ CML-CP; *P < .001. (H) Percentage of LinCD34+ CML-CP cells containing more than 20 γ-H2AX foci/nucleus; *P < .001. (I) Number of colonies from BCR-ABL1 Rad52+/+ and Rad52−/− cells incubated with aptamers; *P < .001 in comparison with untreated and F79A group. (J) Clonogenic activity of LinCD34+ cells from 3 healthy donors and 3 CML-CP and 3 CML-AP patients incubated with aptamers; *P < .001 in comparison with untreated counterparts. (K) Survival of nonobese diabetic/SCID mice bearing BCR-ABL1 Rad52+/+ leukemia and treated with F79 and F79 aptamers (8 mice/group). (L) RT-PCR detection of BCR-ABL1 mRNA in bone marrow mononuclear cells from mice injected with BCR-ABL1 Rad52+/+ leukemia cells and subsequently treated with F79 aptamer, which survived more than 200 days. GAPDH served as positive control. %GFP+ PBL, percentage of GFP+ BCR-ABL1 leukemia cells detected in peripheral blood mononuclear cells.
Figure 4
Figure 4
F79 aptamer induces synthetic lethality in tumor cells displaying genetic BRCA deficiency. (A) Clonogenic activity of GFP+ BRCA1low and BRCA1high UT7-BCR-ABL1 cells transfected with internal ribosome entry site (IRES)-GFP or BRCA1-IRES-GFP constructs untreated (white symbols) and treated with 5 μM F79A (gray symbols) or F79 (blue symbols) aptamer; *P < .001 in comparison with untreated and F79A group. (B) PML-RAR-positive NB4 cells transfected with IRES-GFP (RAD51C-low) and RAD51C-IRES-GFP (RAD51C-high) were treated with 5 μM F79A (gray symbols) and F79 (blue symbols) aptamer. Results represent percentage living GFP+ cells; *P < .001 in comparison with F79A group. (C-E) Cells were irradiated or treated with etoposide and 5 μM F79 (blue) or 5 μM F79A (gray) aptamers, and living cells were counted after 3 to 5 days in Trypan blue. (C) 10Gy γ-irradiated BRCA2-null Capan-1 cells and those with reconstituted BRCA2 expression (BRCA2+), (D) BRCA1-null and BRCA1-reconstituted (BRCA1+) HCC1937 cells, and (E) BRCA1-null and BRCA1-reconstituted (BRCA1+) UWB1.289 cells treated with 5 μM etoposide; *P < .03 in comparison with F79A-treated counterparts.
Figure 5
Figure 5
F79 aptamer enhanced the effects of standard treatment in leukemia cells displaying genetic BRCA-deficient phenotype. (A-C) LinCD34+ CML-CP cells from 3 to 4 patients were untreated (−) (white) and treated with 1 μM imatinib (IM) (salmon), 5μM F79 (blue), and IM+F79 (brown) for 48 hours. (A) Percentage of cells with more than 20 γ-H2AX foci; *P < .01 in comparison with IM. (B) Percentage of annexin V–positive cells; *P < .001 in comparison with IM. (C) Number of colonies ± SD; *P < .01 in comparison with IM. (D,E) LinCD34+ CML-CP cells from 3 to 5 patients/group were labeled with CPD and incubated for 5 days with 1 μM IM (salmon), 5 μM F79 (blue), or IM+F79 (brown) or left untreated (white). (D) Mean number of LinCD34+CD38CPDlow proliferating LSCs; *P = .02 in comparison with IM. (E) Mean number of LinCD34+CD38CPDmax quiescent LSCs; *P = .01 in comparison with IM. (F) Mean number of xenograft cells from 3 freshly diagnosed BCR-ABL1 B-ALL patients treated for 5 days with 1 μM IM (salmon), 5 μM F79 (blue), IM+F79 (brown), or left untreated (white); *P < .01 in comparison with IM. (G) Mean number of xenograft cells from 3 relapsed B-ALL patients carrying BCR-ABL1(T315I) mutation treated for 5 days with 12.5 nM ponatinib (PN) (salmon), 5 μM F79 (blue), or PN+F79 (brown) or left untreated (white). Results represent mean number ± SD of living cells; *P < .05 in comparison with PN. (H-J) APL primary cells from 3 patients were incubated with 5 μM F79 aptamer (F79), 4 μM ATRA (A), or F79+ATRA or were left untreated (−). (H) Living cells were counted in Trypan blue 9 days later. (I) Polynuclear differentiated cells counted after staining in Giemsa. (J) Annexin V–positive cells assessed by a fluorescence-activated cell sorter; *P < .05 in comparison with group A.
Figure 6
Figure 6
F79 aptamer exerts synthetic lethality in acute leukemias displaying epigenetic BRCA-deficient phenotype. (A) AML (n = 15), (B) BCR-ABL1 -negative B-ALL (n = 18), and (C) T-ALL (n = 10) xenograft cells and CD34+ (n = 3), B-cells (n = 11) and T-cells (n = 17) from healthy donors were employed here. (mRNA) Microarray detection of mRNA for BRCA1 and BRCA2; each circle represents an individual patient; BRCA1 and/or BRCA2 high (red) and low (blue) samples were used for further studies. Green circles represent cells from healthy donors. (BRCA1 and Ki67) Immunofluorescent quantitation of BRCA1 protein levels in Ki67-positive cells and percentage of Ki67-positive cells. Representative cells highlighting the differences of BRCA1 (red) levels in Ki67-positive cells (green) are shown; nuclei are counterstained with 4,6 diamidino-2-phenylindole. (F79) Xenograft cells were incubated in vitro with 5 μM F79 aptamer. (DNR+F79) Xenograft cells were treated in vitro with daunorubicin (0.2 μM for AML, 0.1 μM for B-ALL and T-ALL) and 5 μM F79 aptamer. Results represent percentage of surviving cells; *P < .05 in comparison with BRCAhigh patients.
Figure 7
Figure 7
Genetic and epigenetic profiling as search engines to select BRCA-deficient tumors sensitive to synthetic lethality by targeting RAD52. Genetic profiling will identify patients with tumors harboring BRCA1/2 mutations or expressing oncogenes (such as BCR-ABL1 and PML-RAR) that directly or indirectly cause genetic BRCA deficiency. Gene expression profiling by microarray analysis or qPCR should select individual patients with tumors displaying epigenetic BRCA-deficient phenotype.

References

    1. Frame FM, Maitland NJ. Cancer stem cells, models of study and implications of therapy resistance mechanisms. Adv Exp Med Biol. 2011;720:105–118. - PubMed
    1. Sallmyr A, Fan J, Rassool FV. Genomic instability in myeloid malignancies: increased reactive oxygen species (ROS), DNA double strand breaks (DSBs) and error-prone repair. Cancer Lett. 2008;270(1):1–9. - PubMed
    1. Callén E, Jankovic M, Difilippantonio S, et al. ATM prevents the persistence and propagation of chromosome breaks in lymphocytes. Cell. 2007;130(1):63–75. - PubMed
    1. Hasham MG, Donghia NM, Coffey E, et al. Widespread genomic breaks generated by activation-induced cytidine deaminase are prevented by homologous recombination. Nat Immunol. 2010;11(9):820–826. - PMC - PubMed
    1. Curtin NJ. DNA repair dysregulation from cancer driver to therapeutic target. Nat Rev Cancer. 2012;12(12):801–817. - PubMed

Publication types

MeSH terms

Associated data