. 2013 Jul 23;110(30):12450-5.
doi: 10.1073/pnas.1300833110. Epub 2013 Jul 8.

Rapid evolution of the human gut virome

Affiliations

Rapid evolution of the human gut virome

Samuel Minot et al. Proc Natl Acad Sci U S A. .

Abstract

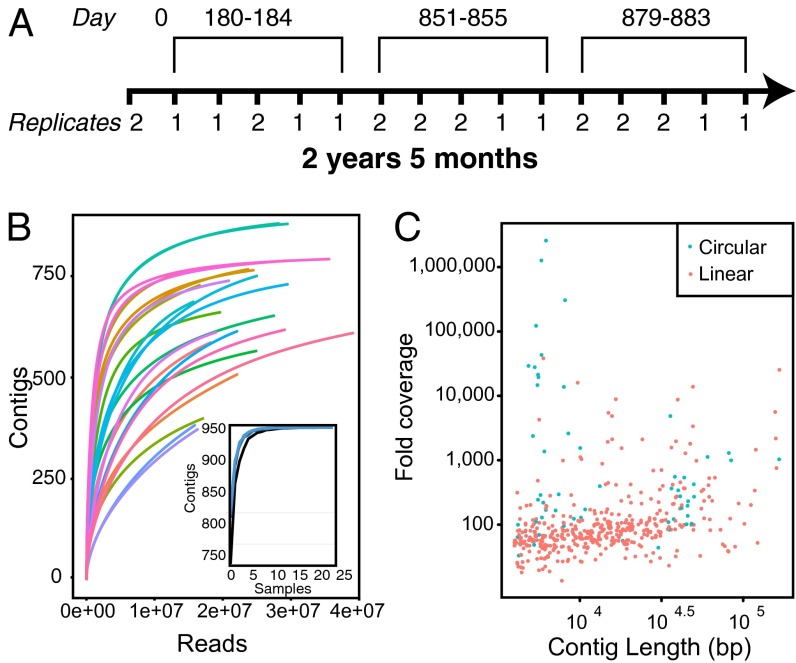
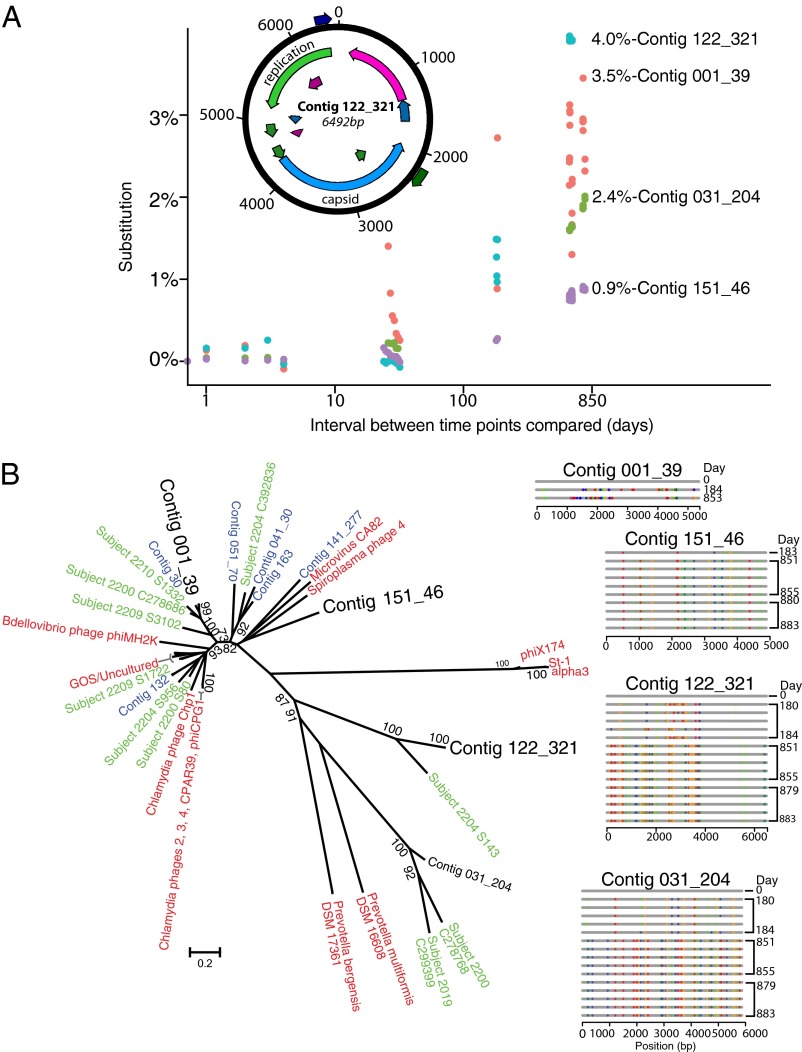
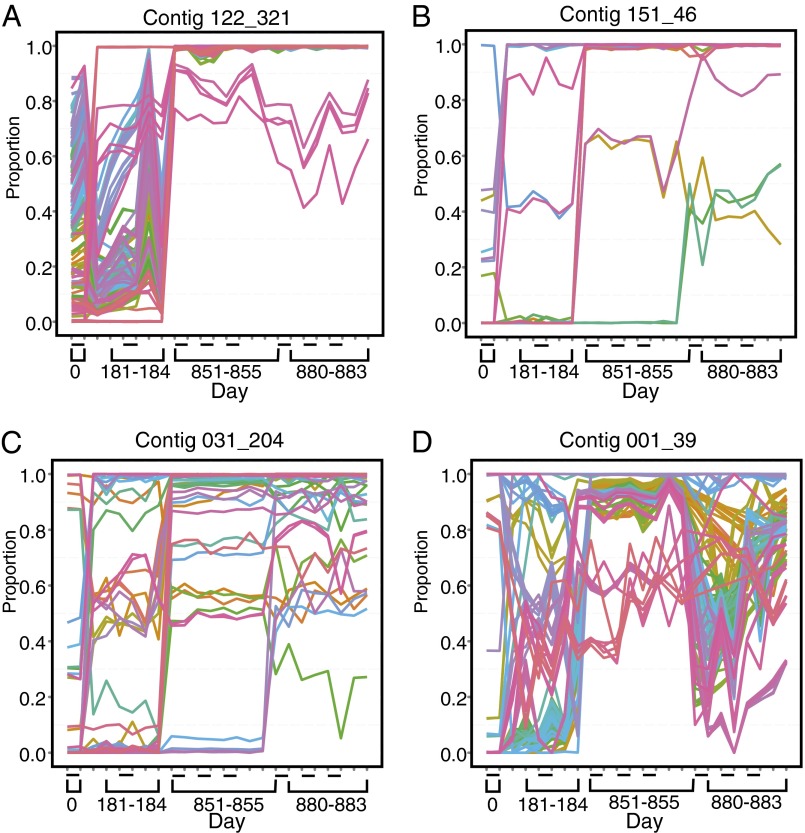
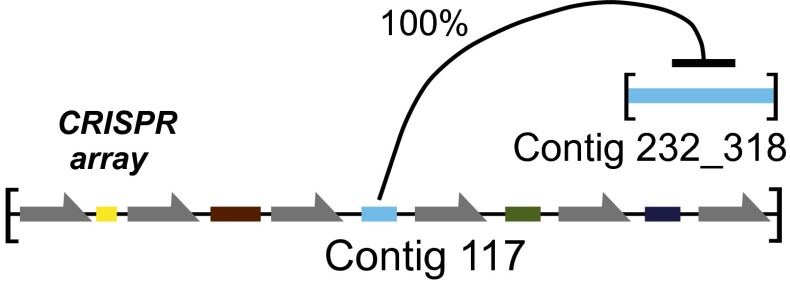
Humans are colonized by immense populations of viruses, which metagenomic analysis shows are mostly unique to each individual. To investigate the origin and evolution of the human gut virome, we analyzed the viral community of one adult individual over 2.5 y by extremely deep metagenomic sequencing (56 billion bases of purified viral sequence from 24 longitudinal fecal samples). After assembly, 478 well-determined contigs could be identified, which are inferred to correspond mostly to previously unstudied bacteriophage genomes. Fully 80% of these types persisted throughout the duration of the 2.5-y study, indicating long-term global stability. Mechanisms of base substitution, rates of accumulation, and the amount of variation varied among viral types. Temperate phages showed relatively lower mutation rates, consistent with replication by accurate bacterial DNA polymerases in the integrated prophage state. In contrast, Microviridae, which are lytic bacteriophages with single-stranded circular DNA genomes, showed high substitution rates (>10(-5) per nucleotide each day), so that sequence divergence over the 2.5-y period studied approached values sufficient to distinguish new viral species. Longitudinal changes also were associated with diversity-generating retroelements and virus-encoded Clustered Regularly Interspaced Short Palindromic Repeats arrays. We infer that the extreme interpersonal diversity of human gut viruses derives from two sources, persistence of a small portion of the global virome within the gut of each individual and rapid evolution of some long-term virome members.

Keywords: CRISPR; diversity generating retroelement; metagenomics; microbiome.


Conflict of interest statement

The authors declare no conflict of interest.

Figures

Fig. 1.
Fig. 1.
Longitudinal analysis of the human gut virome from a single individual. (A) Timeline of sample collection. Note that at some time points, two separate portions of the stool sample, taken approximately 1 cm apart, were processed and sequenced independently to assess reproducibility. (B) Rarefaction analysis of sampling depth by number of reads; detection of each contig is scored as positive if 50% of the contig is covered by sequence reads. (Inset) Contig recovery. The x-axis is the number of samples included (black line: 2 million reads; blue line: 15 million reads). (C) Contig spectrum, relating the lengths of the contigs assembled in bas pairs (x-axis) to the depth of coverage (y-axis). Circular contigs are shown as blue and linear contigs as red.
Fig. 2.
Fig. 2.
Stability and change in the gut virome of the individual studied. (A) Conserved membership in the viral community over time intervals analyzed using the Jaccard index. Because many pairwise comparisons are possible between the 24 time points, we plotted shared membership for all pairs of time points as a function of the length of time between each pair. The x-axis shows the time interval between time points, and the y-axis shows shared membership in the two communities compared summarized using the Jaccard index. Perfect identity yields a value of 1, and complete divergence yields a value of 0. (B) Comparison of substitution rates among viral families. Temperate phages are shown in blue, and lytic phages are in red. The viral families studied are shown at the bottom; substitution rates on the y-axis are substitutions per base, per day. Only contigs with clear taxonomic attributions were analyzed; such contigs comprise a minority of all contigs.
Fig. 3.
Fig. 3.
Longitudinal DNA substitution in Microviridae. (A) Substitution rates in the four Microviridae genomes with the highest values measured. Because many pairwise comparisons are possible between the time points at which each virus was detected, the plot shows distances between time points on the x-axis and the percent substitution on the y-axis. The percent substitution values within each time point were subtracted from the between-time point values before the plot was constructed. Colors differentiate the four viruses studied. (Inset) The genome with the highest substitution rate (contig 122_321). (B) Phylogenetic tree of microphages detected in this and other studies. The four microphage contigs with the highest substitution rates observed in this study are shown in large black lettering. Database microphages are shown in red, microphages from ref. are shown in green, and additional microphages identified in this study are shown in blue. (Scale bar: the proportion of amino acid substitutions within the 919-aa major coat protein, which was aligned to make the tree.) Longitudinal maps of substitution accumulation are shown to the right. Note that all of the variations shown in the sequences to the right are plotted in the phylogenetic tree but are not visible because of the comparatively low divergence. Only time points with high-quality complete-genome assemblies are shown.
Fig. 4.
Fig. 4.
Relative abundance of SNPs in four Microviridae genomes analyzed longitudinally. Contigs studied are marked above each figure panel. The x-axis shows elapsed time since the start of the study. The y-axis shows the relative proportion of each variant in the population. The dashes on the x-axis show replicate analysis of single time points, allowing assessment of within-time point variability. Only positions with SNPs that transitioned from minor (<0.5) to major (>0.5) are plotted. The colors are used to make the different positions easier to visualize. Panel labels A–D show data for the contigs indicated at the top of each panel.
Fig. 5.
Fig. 5.
A phage-encoded CRISPR array targeting another phage. The array shown (contig 117) was detected in the viral contig collection. Gray indicates CRISPR repeats, and colors indicate CRISPR spacers. The target contig (contig 102) also was identified and observed to be present at some of the same time points; three other contigs also were targeted by the CRISPR array in contig 117. The CRISPR array in viral contig 117 is closely similar to CRISPR-2 detected in the total stool metagenomic sequencing.

Comment in

References

    1. Rohwer F. Global phage diversity. Cell. 2003;113(2):141. - PubMed
    1. Schoenfeld T, et al. Functional viral metagenomics and the next generation of molecular tools. Trends Microbiol. 2010;18(1):20–29. - PMC - PubMed
    1. Suttle CA. Viruses in the sea. Nature. 2005;437(7057):356–361. - PubMed
    1. Reyes A, et al. Viruses in the faecal microbiota of monozygotic twins and their mothers. Nature. 2010;466(7304):334–338. - PMC - PubMed
    1. Minot S, et al. The human gut virome: inter-individual variation and dynamic response to diet. Genome Res. 2011;21(10):1616–1625. - PMC - PubMed

Publication types

LinkOut - more resources