

Fast spatiotemporal correlation spectroscopy to determine protein lateral diffusion laws in live cell membranes
- PMID: 23836651
- PMCID: PMC3725058
- DOI: 10.1073/pnas.1222097110
Fast spatiotemporal correlation spectroscopy to determine protein lateral diffusion laws in live cell membranes
Abstract
Spatial distribution and dynamics of plasma-membrane proteins are thought to be modulated by lipid composition and by the underlying cytoskeleton, which forms transient barriers to diffusion. So far this idea was probed by single-particle tracking of membrane components in which gold particles or antibodies were used to individually monitor the molecules of interest. Unfortunately, the relatively large particles needed for single-particle tracking can in principle alter the very dynamics under study. Here, we use a method that makes it possible to investigate plasma-membrane proteins by means of small molecular labels, specifically single GFP constructs. First, fast imaging of the region of interest on the membrane is performed. For each time delay in the resulting stack of images the average spatial correlation function is calculated. We show that by fitting the series of correlation functions, the actual protein "diffusion law" can be obtained directly from imaging, in the form of a mean-square displacement vs. time-delay plot, with no need for interpretative models. This approach is tested with several simulated 2D diffusion conditions and in live Chinese hamster ovary cells with a GFP-tagged transmembrane transferrin receptor, a well-known benchmark of membrane-skeleton-dependent transiently confined diffusion. This approach does not require extraction of the individual trajectories and can be used also with dim and dense molecules. We argue that it represents a powerful tool for the determination of kinetic and thermodynamic parameters over very wide spatial and temporal scales.
Keywords: fluorescence; membrane heterogeneity; protein dynamics; single molecule; transient confinement.
Conflict of interest statement
The authors declare no conflict of interest.
Figures

 into (B) a stack of images representing the spatiotemporal evolution of correlation
  . (C) When particle dynamics is governed only by diffusion, the maximum of correlation remains in the origin (peak projection on Cartesian axis). It is possible to approximate
  with a Gaussian function whose variance corresponds to the particles average iMSD. (D) Plot of iMSD vs. time may be used to distinguish, for example, between free and confined diffusion.

 . (A) iMSD is linear with increasing
  values for increasing particle sizes. PSF on ordinate indicates the contribution of the instrumental waist to σ0 value. (B) Accordance between the theoretical R value (imposed in the simulation) and that recovered from the analysis.

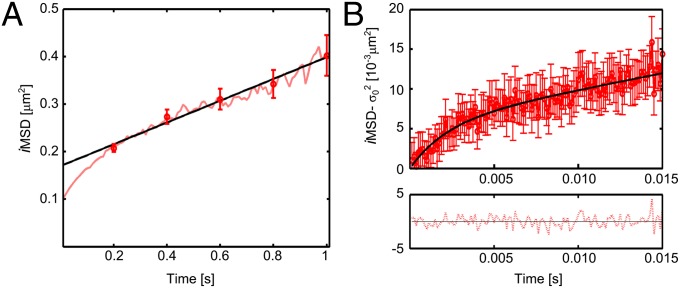
 : faster acquisition is needed to reveal subtle dynamics. (A) Comparison of the GFP-TfR iMSD calculated at 10-ms repetition time (light red line) with that at 200 ms (red dots). Black line represents the best linear fit of red dots. (B) Representative iMSD derived from a line-scanning measurement (125-µs repetition time).
References
-
- Singer SJ, Nicolson GL. 1972. The fluid mosaic model of the structure of cell membranes. Science 175(4023):720–731.
-
- Ryan TA, Myers J, Holowka D, Baird B, Webb WW. 1988. Molecular crowding on the cell surface. Science 239(4835):61--64. - PubMed
-
- Edidin M. The state of lipid rafts: From model membranes to cells. Annu Rev Biophys Biomol Struct. 2003;32:257–283. - PubMed
-
- Simons K, Vaz WLC. Model systems, lipid rafts, and cell membranes. Annu Rev Biophys Biomol Struct. 2004;33:269–295. - PubMed
-
- Kusumi A, Koyama-Honda I, Suzuki K. Molecular dynamics and interactions for creation of stimulation-induced stabilized rafts from small unstable steady-state rafts. Traffic. 2004;5(4):213–230. - PubMed
Publication types
MeSH terms
Substances
Grants and funding
LinkOut - more resources
Full Text Sources
Other Literature Sources
