. 2013 Jul 23;110(30):12331-6.
doi: 10.1073/pnas.1222684110. Epub 2013 Jul 8.

Loss of corepressor PER2 under hypoxia up-regulates OCT1-mediated EMT gene expression and enhances tumor malignancy

Affiliations

Loss of corepressor PER2 under hypoxia up-regulates OCT1-mediated EMT gene expression and enhances tumor malignancy

Wendy W Hwang-Verslues et al. Proc Natl Acad Sci U S A. .

Abstract

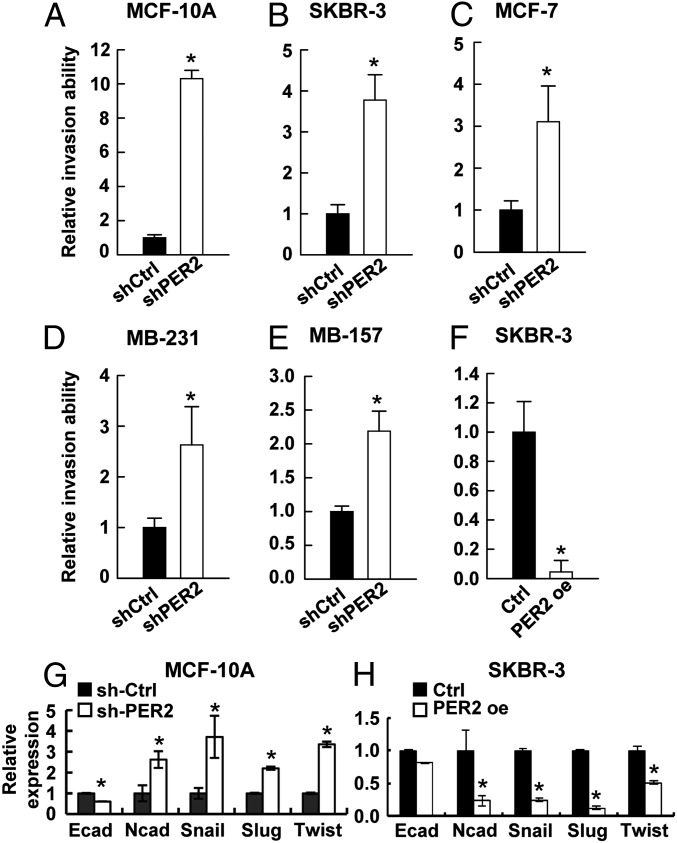
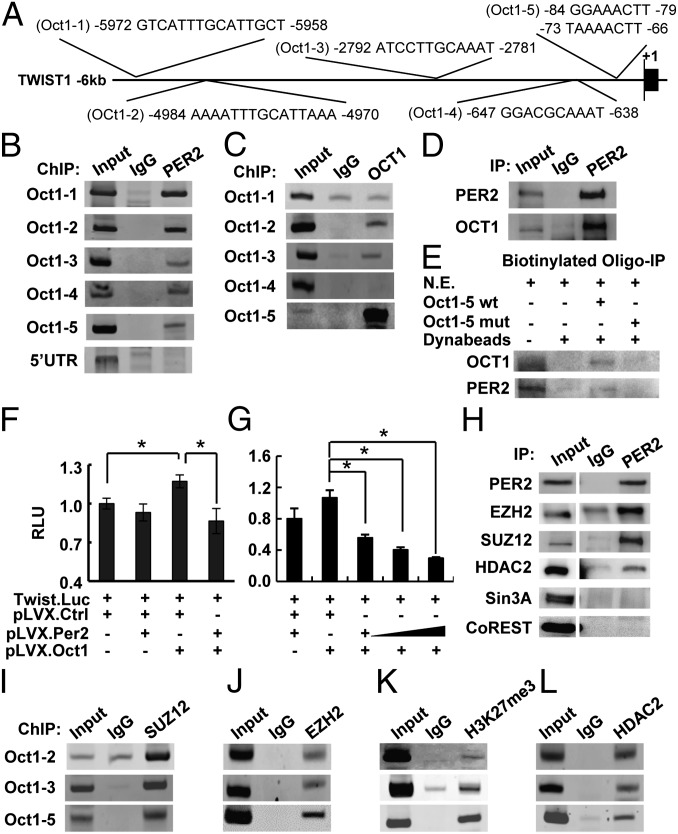
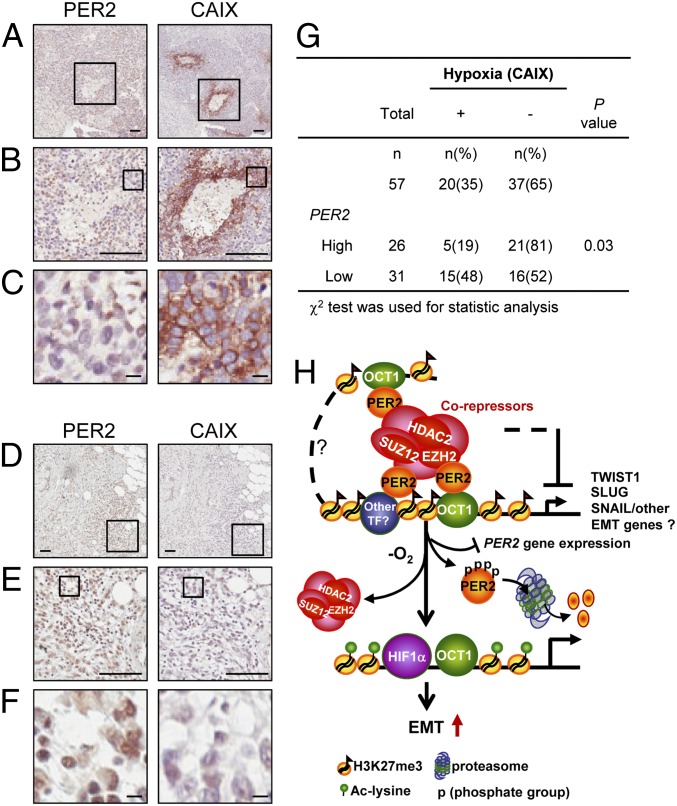
The circadian clock gene Period2 (PER2) has been suggested to be a tumor suppressor. However, detailed mechanistic evidence has not been provided to support this hypothesis. We found that loss of PER2 enhanced invasion and activated expression of epithelial-mesenchymal transition (EMT) genes including TWIST1, SLUG, and SNAIL. This finding was corroborated by clinical observation that PER2 down-regulation was associated with poor prognosis in breast cancer patients. We further demonstrated that PER2 served as a transcriptional corepressor, which recruited polycomb proteins EZH2 and SUZ12 as well as HDAC2 to octamer transcription factor 1 (OCT1) (POU2F1) binding sites of the TWIST1 and SLUG promoters to repress expression of these EMT genes. Hypoxia, a condition commonly observed in tumors, caused PER2 degradation and disrupted the PER2 repressor complex, leading to activation of EMT gene expression. This result was further supported by clinical data showing a significant negative correlation between hypoxia and PER2. Thus, our findings clearly demonstrate the tumor suppression function of PER2 and elucidate a pathway by which hypoxia promotes EMT via degradation of PER2.

Keywords: HIF1alpha; breast cancer stem cell.


Conflict of interest statement

Conflict of interest statement: According to the UCI policy, W.-H.L. declares that he serves as a member of Board of Directors of the biotech company, GeneTex. This arrangement has been reviewed and approved by UCI conflict of interest committee.

Figures

Fig. 1.
Fig. 1.
PER2 suppression promoted tumorigenic ability. (A–C) Immunoblot analysis of PER2 (A), PER1 (B), and PER3 (C) in breast cancer cells (MB-231 and SKBR-3) and normal mammary epithelial cells (MCF-10A and M10). Tubulin was used as a loading control. Relative expression (RE) level of PER protein in SKBR-3, MCF-10A, and M10 relative to MB-231 is indicated. (D and E) Soft agar colony formation (SACF) assay using MCF-10A (D) and SKBR-3 (E) cells infected with lentiviral-control shRNA (sh-Ctrl) or sh-PER2. (F) SACF assay using SKBR-3 cells transduced with lentiviral control (Ctrl) or PER2. PER2 expression in these cells was examined with immunoblot. Tubulin was used as a loading control. Data show means ± SD. *P < 0.05 (Student t test). (G) Tumorigenesis assay of NOD/SCID mice injected with SKBR-3 lentiviral Ctrl or PER2 overexpressing cells. Cell dose: 3 × 10⁶ cells per fat pad. Five mice were used for each group. Data show means ± SD. *P < 0.05 (Student t test) (SI Appendix, Fig. S1).
Fig. 2.
Fig. 2.
PER2 suppression promoted invasion and EMT gene expression. (A–E) Invasion assay for MCF-10A (A), SKBR-3 (B), MCF-7 (C), MB-231 (D), and MB-157 (E) cells transduced with lentiviral sh-Ctrl or sh-PER2. (F) Invasion assay for SKBR-3 cells transduced with lentiviral control (Ctrl) or PER2. (G and H) mRNA expression of EMT markers (E-cadherin and N-cadherin) and regulators (SLUG, SNAIL, TWIST1) determined by qRT-PCR in MCF-10A infected with sh-Ctrl or sh-Per2 (G) and in Ctrl or PER2 overexpressing SKBR-3 (H). Data are means ± SD. *P < 0.05 (Student t test). (SI Appendix, Figs. S2 and S3).
Fig. 3.
Fig. 3.
PER2 recruited corepressors to suppress OCT1-mediated TWIST1 promoter activity. (A) Diagram showing the five predicted OCT1 sites (Oct1-1–Oct1-5) on the TWIST1 promoter. (B and C) ChIP of PER2 (B) or OCT1 (C) on the TWIST1 promoter in MCF-10A cells. Normal IgG (IgG) and a site in 5′-UTR were used as controls for PER2-promoter association. (D) Coimmunoprecipitation (Co-IP) of PER2 and OCT1 in MCF-10A cells. Normal IgG was used as a control. (E) Immunoprecipitation of OCT1 or PER2 using MCF-10A nuclear extract (N.E.) and biotin-labeled oligonucleotides containing WT or mutated (mut) Oct1-5 site. (F and G) Relative fold change in luciferase activity of the TWIST1 reporter construct in HEK-293T cells transiently cotransfected with OCT1 or/and PER2 expression plasmids. Data show means ± SD. *P < 0.05 (Student t test). (H) Co-IP of PER2 and EZH2, SUZ12, HDAC2, Sin3A, or CoREST in MCF-10A cells. (Left) EZH2 and HDAC2 immunoblots were input images from the same blots with different exposure time. (I–L) ChIP of SUZ12 (I), EZH2 (J), trimethylated Histone 3 lysine 27 (H3K27me3) (K), and HDAC2 (L) in MCF-10A cells (SI Appendix, Figs. S4 and S5).
Fig. 4.
Fig. 4.
Hypoxia-induced PER2 degradation resulted in suppressor complex dissociation and de-repression of TWIST1 promoter transactivation. (A) Time course assay using MCF-10A cells cultured in normoxia or hypoxic conditions (1% oxygen). PER2 levels were determined by Immunoblotting. HIF1α accumulation was used to verify the activation of hypoxic response. (B) Time course assay using MCF-10A treated with cycloheximide (CHX) (100 μg/mL) in normoxia or hypoxia. PER2 expression was determined by immunoblotting. (C) Phosphorylated PER2 species in MCF-10A cells cultured in hypoxia were detected using immunoblotting with PER2-S662 phospho-specific antibody. (D) Immunofluorescence (IF) of PER2 in MCF-10A cells at 6 h in normoxia or hypoxia. Nuclear matrix protein p84 and DAPI were used as nuclear staining controls. Arrows indicate PER2 staining. (Scale bar, 10 μm.) (E) Time course assay using MCF-10A treated with proteasome inhibitors MG132 (20 μM) or lactacystin (20 μM) in hypoxia. PER2 expression was determined by immunoblotting. (F) Time course reporter assay using MCF-10A transfected with the TWIST1 promoter construct in hypoxia. Relative fold change in luciferase activity was shown. Data shown is means ± SD. *P < 0.05 (Student t test). (G) Time course ChIP of PER2, OCT1, EZH2, SUZ12, HeK27me3, HDAC2, HIF1α, and acetylated lysine (Ac-lysine) on Oct1-5 region of the TWIST1 promoter in MCF-10A cells cultured in hypoxia. For all immunoblot assays, tubulin was used as a loading control. All experiments were performed at least two times with similar results. One representative result is shown (SI Appendix, Figs. S6–S9).
Fig. 5.
Fig. 5.
Hypoxia induces PER2 suppression. (A–F) Representative pictures of the IHC serial sections of PER2 nuclear and CAIX membrane staining in a CAIX-positive/PER2-low case (A–C) and a CAIX-negative/PER2-high case (D–F). Boxes show the enlarged area. (A and D) Original magnification, 100×. (Scale bar, 100 μm.) B and E, original magnification, 400×. (Scale bar, 100 μm.) C and F, original magnification, 1,600×. (Scale bar, 10 μm.) (G) Correlation of CAIX with PER2 gene expression in 57 breast cancer cases. χ2 test was used. (H) Diagram of PER2 function as a repressor in EMT regulation. PER2 recruits a corepressor complex including EZH2, SUZ12, and HDAC2 to the promoters of EMT genes via interaction with OCT1. Hypoxia induces PER2 protein proteasomal degradation and PER2 gene suppression and causes dissociation of corepressors, which leads to reactivation of EMT gene expression (SI Appendix, Fig. S10).
Fig. 6.
Fig. 6.
PER2 suppression is associated with tumor malignancy and poor prognosis. (A) Regression analysis of PER2 mRNA expression vs. tumor size in 101 breast cancer patients. (B) Trend test of PER2 expression and histological grading in breast cancer patients. (C) Comparison of the overall survival periods of patients with different levels of PER2 gene expression using the Kaplan-Meier method. (D) Comparison of the overall survival periods of patients with different patterns of PER2 and TWIST1 gene expression using the Kaplan–Meier method. (E) Schematic diagram of the central role of PER2 in tumorigenesis promoted by hypoxic microenvironments.

References

    1. Stephan FK, Zucker I. Circadian rhythms in drinking behavior and locomotor activity of rats are eliminated by hypothalamic lesions. Proc Natl Acad Sci USA. 1972;69(6):1583–1586. - PMC - PubMed
    1. Bartness TJ, Song CK, Demas GE. SCN efferents to peripheral tissues: Implications for biological rhythms. J Biol Rhythms. 2001;16(3):196–204. - PubMed
    1. Herzog ED. Neurons and networks in daily rhythms. Nat Rev Neurosci. 2007;8(10):790–802. - PubMed
    1. Kuhlman SJ, McMahon DG. Encoding the ins and outs of circadian pacemaking. J Biol Rhythms. 2006;21(6):470–481. - PubMed
    1. Reppert SM, Weaver DR. Coordination of circadian timing in mammals. Nature. 2002;418(6901):935–941. - PubMed

Publication types

Substances