. 2013 Jul;32(7):1228-35.
doi: 10.1377/hlthaff.2012.0773.

Medicare beneficiaries more likely to receive appropriate ambulatory services in HMOs than in traditional medicare

Affiliations

Medicare beneficiaries more likely to receive appropriate ambulatory services in HMOs than in traditional medicare

John Z Ayanian et al. Health Aff (Millwood). 2013 Jul.

Abstract

With quality-of-care bonus payments now available for Medicare Advantage health maintenance organizations (HMOs) and for accountable care organizations in traditional Medicare, the need to understand the relative quality of care delivered to Medicare enrollees has increased. We compared the quality of ambulatory care from 2003 through 2009 between beneficiaries enrolled in Medicare Advantage HMOs and those enrolled in traditional Medicare, and we assessed how the performance of various types of Medicare HMOs differed from that of traditional Medicare for these same measures. We found that beneficiaries in Medicare HMOs were consistently more likely than those in traditional Medicare to receive appropriate breast cancer screening, diabetes care, and cholesterol testing for cardiovascular disease. We also found that Medicare HMO physicians were rated less favorably by their patients than were physicians in traditional Medicare in 2003; however, by 2009 the opposite was true. Not-for-profit, larger, and older Medicare HMOs performed consistently more favorably on clinical measures and ratings of care than for-profit, smaller, and newer HMOs. Our results suggest that the positive effects of more-integrated delivery systems on the quality of ambulatory care in Medicare HMOs may outweigh the potential incentives to restrict care under capitated payments.

Keywords: Elderly; Managed Care—Medicare; Medicare; Quality Of Care.


Figures
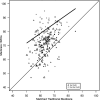
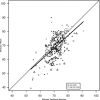
Exhibit A6
Exhibit A6. Screening Mammography in Medicare HMOs Matched to Local Traditional Medicare Beneficiaries in 2009
Source: Authors’ analysis of clinical quality measures for Medicare HMOs and Part A and B claims data for traditional Medicare. Notes: Estimates are derived from hierarchical regression models weighted by HMO enrollment and with random effects for individual health plans. The y-axis depicts performance for HMO plans and the x-axis depicts the corresponding performance for matched traditional Medicare enrollees in the same local areas. Circles and triangles represent not-for-profit and for-profit HMOs, respectively, and larger symbols indicate HMOs with ≥25,000 enrollees. Points above the lighter diagonal line indicate HMOs that performed better than traditional Medicare, and points below this line indicate worse HMO performance than traditional Medicare. The bolded regression line summarizes the overall differences across the range of HMO performance.
Exhibit A7
Exhibit A7. Influenza Vaccinations in Medicare HMOs Matched to Local Traditional Medicare Beneficiaries in 2009
Source: Authors’ analysis of Medicare Consumer Assessment of Healthcare Providers and Systems survey data. Notes: Estimates are derived from hierarchical regression models weighted by HMO enrollment and with random effects for individual health plans. The y-axis depicts performance for HMO plans and the x-axis depicts the corresponding performance for matched traditional Medicare enrollees in the same local areas. Circles and triangles represent not-for-profit and for-profit HMOs, respectively, and larger symbols indicate HMOs with ≥25,000 enrollees. Points above the lighter diagonal line indicate HMOs that performed better than traditional Medicare, and points below this line indicate worse HMO performance than traditional Medicare. The bolded regression line summarizes the overall differences across the range of HMO performance.
Exhibit 1
Exhibit 1. Quality of Care on Clinical Measures for Medicare HMOs Matched to Traditional Medicare Beneficiaries in 2003 or 2006 and 2009
Source: Authors’ analysis of HMO clinical quality data and Part A and B claims data for traditional Medicare from CMS Notes: HMO and traditional Medicare enrollees were matched by age, sex and race/ethnicity in local areas and weighted by HMO plan enrollment to derive national estimates. For cholesterol testing, the measure specifications changed in 2006 so earlier years are not presented. All differences between HMOs and traditional Medicare were statistically significant (p<0.001) for each measure in each study year.
Exhibit 2
Exhibit 2. Quality of Care on Survey Measures for Medicare HMOs Matched to Traditional Medicare Beneficiaries in 2003 and 2009
Source: Authors’ analysis of Medicare survey data from CMS Notes: HMO and traditional Medicare enrollees were matched by age, sex, race/ethnicity self-reported health status within counties and weighted by HMO plan enrollment to derive national estimates with two-tailed p values for each measure by study year. For ratings of personal doctor and specialists, proportions represent ratings of 9 or 10 on a 0-10 scale. All differences between HMOs and traditional Medicare were statistically significant for each measure in each study year (p<0.001 for all measures except p=0.02 for ratings of specialists in 2009).
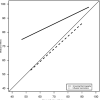
Exhibit 4
Exhibit 4. Screening Mammography and Influenza Vaccinations in Medicare HMOs Matched to Local Traditional Medicare Beneficiaries in 2009
Source: Authors’ analysis of HMO clinical quality and survey data and Part A and B claims data for traditional Medicare. Notes: Estimates are derived from hierarchical regression models weighted by HMO enrollment and with random effects for individual health plans. The y-axis depicts performance for HMO plans, and the x-axis depicts the corresponding performance for matched traditional Medicare enrollees in the same local areas. The bolded and dashed regression lines summarize the overall differences across the range of HMO performance for screening mammography and influenza vaccinations, respectively. The area above the 45-degree diagonal line indicates better HMO performance than traditional Medicare, and the area below this line indicates worse HMO performance than traditional Medicare.

Similar articles

Cited by

References

    1. McGuire TG, Newhouse JP, Sinaiko AD. An economic history of Medicare part C. Milbank Q. 2011;89(2):289–332. - PMC - PubMed
    1. Gold M, Jacobson G, Damico A, Neuman T. Medicare Advantage 2012 Data Spotlight: Enrollment Market Update. Kaiser Family Foundation. 2012 Jun; [May 20, 2013]; Available from: http://www.kff.org/medicare/upload/8323.pdf.
    1. Brennan N, Shepard M. Comparing quality of care in the Medicare program. Am J Manag Care. 2010 Nov;16(11):841–8. - PubMed
    1. Landon BE, Zaslavsky AM, Bernard SL, Cioffi MJ, Cleary PD. Comparison of performance of traditional Medicare vs Medicare managed care. JAMA. 2004;291(14):1744–52. - PubMed
    1. Keenan PS, Elliott MN, Cleary PD, Zaslavsky AM, Landon BE. Quality assessments by sick and healthy beneficiaries in traditional Medicare and Medicare managed care. Med Care. 2009 Aug;47(8):882–8. - PubMed

Publication types

LinkOut - more resources