. 2013 Aug 16;288(33):24200-12.
doi: 10.1074/jbc.M113.471433. Epub 2013 Jul 8.

Maternal embryonic leucine zipper kinase (MELK) reduces replication stress in glioblastoma cells

Affiliations

Maternal embryonic leucine zipper kinase (MELK) reduces replication stress in glioblastoma cells

Cenk Kig et al. J Biol Chem. .

Retraction in

Abstract

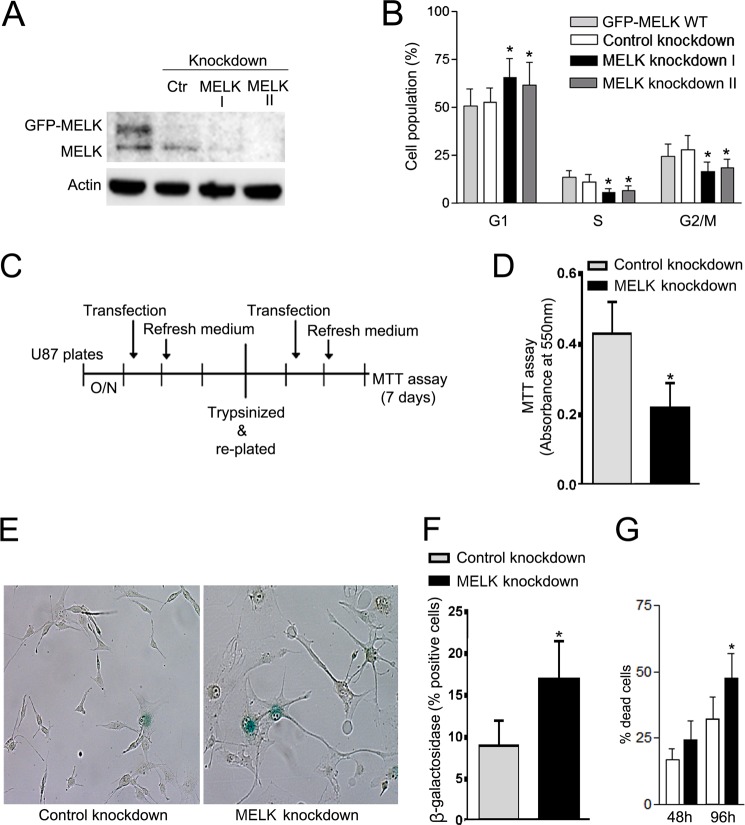
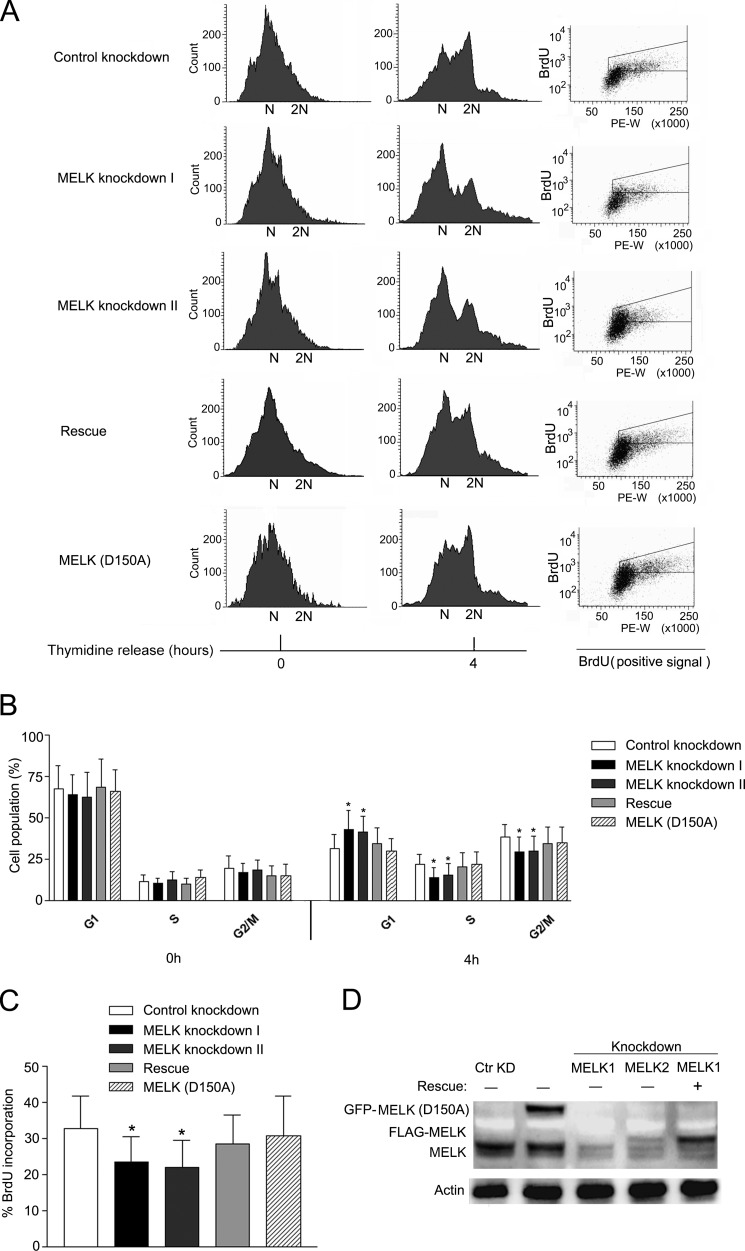
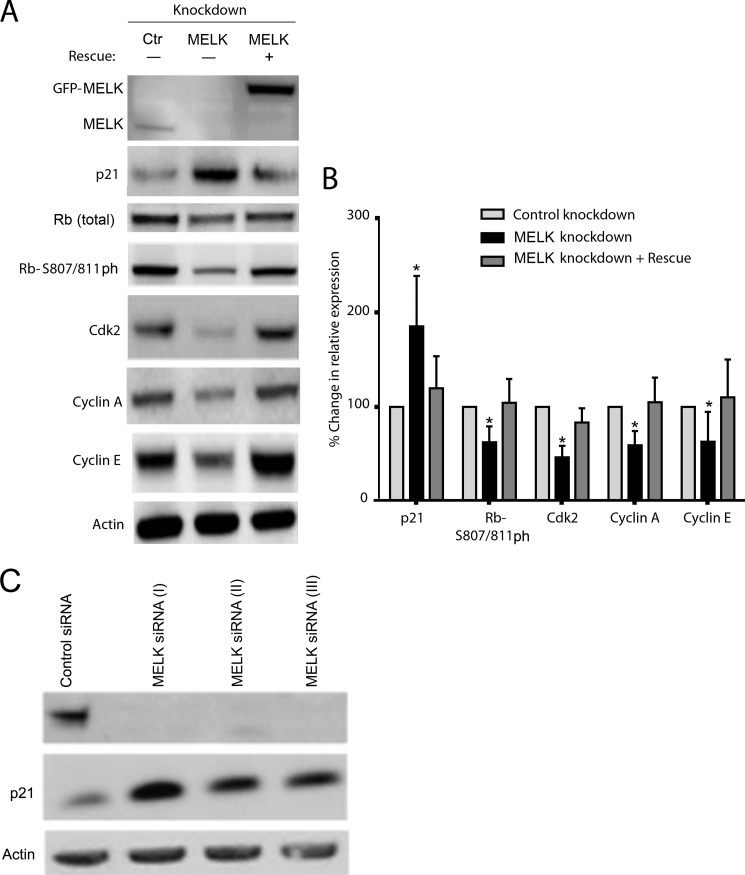
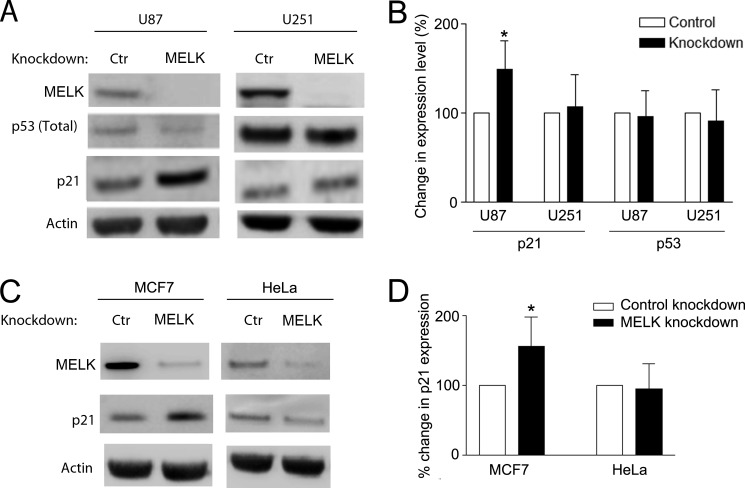
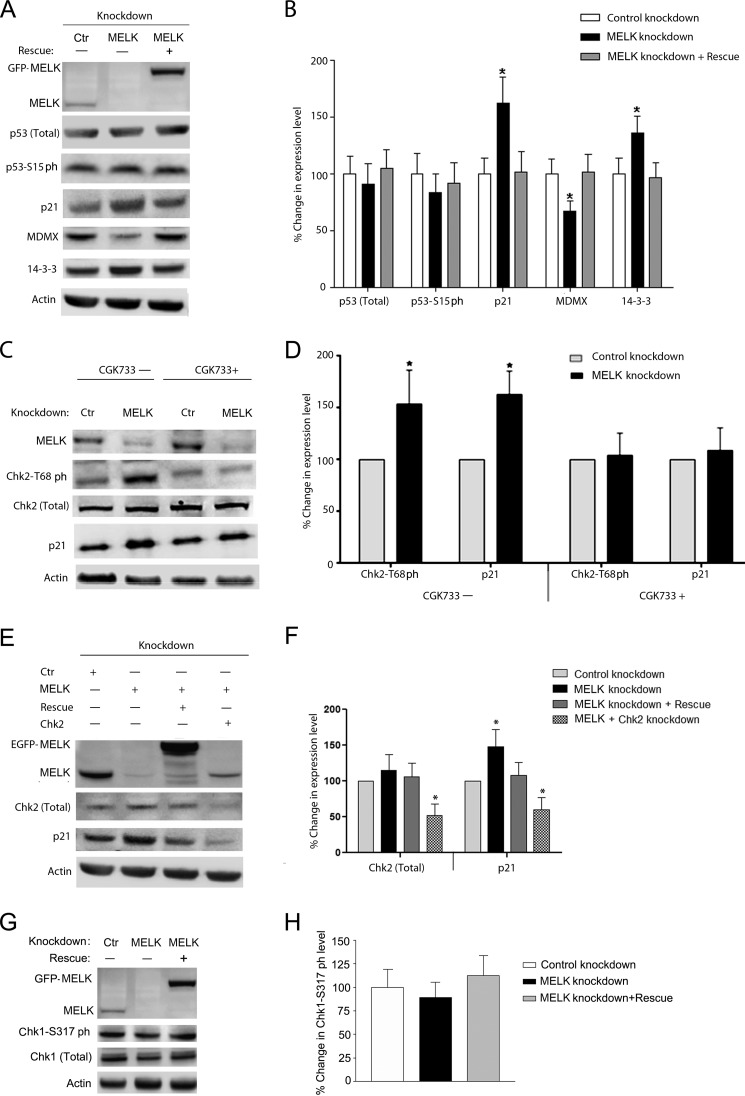
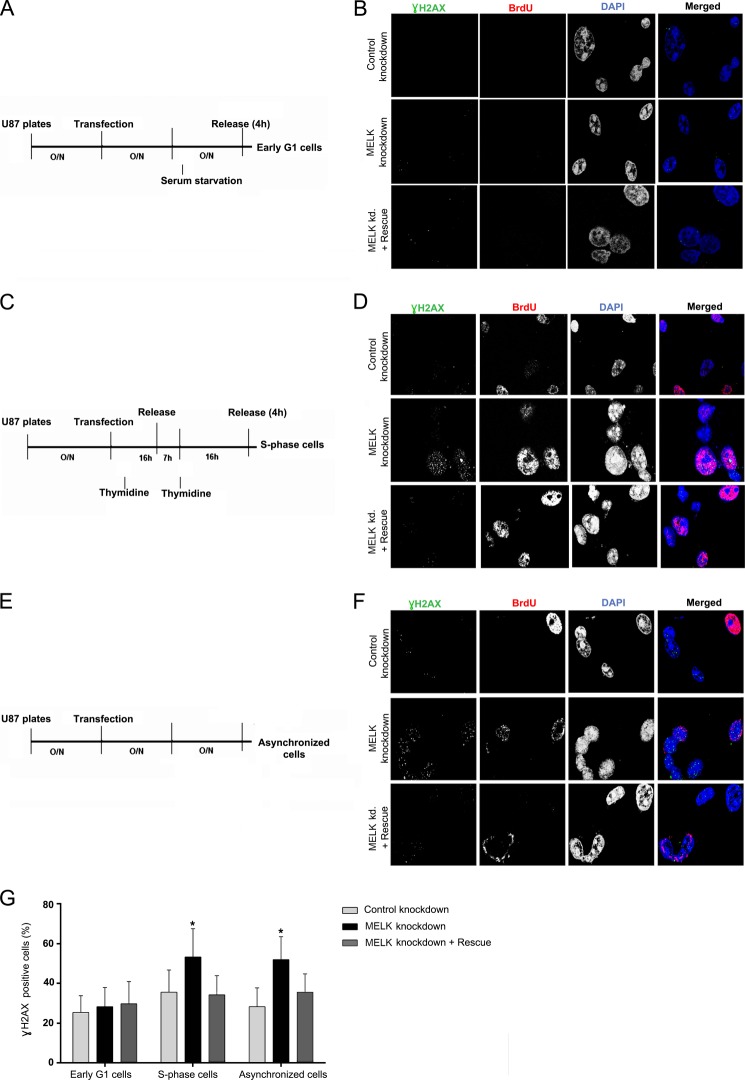
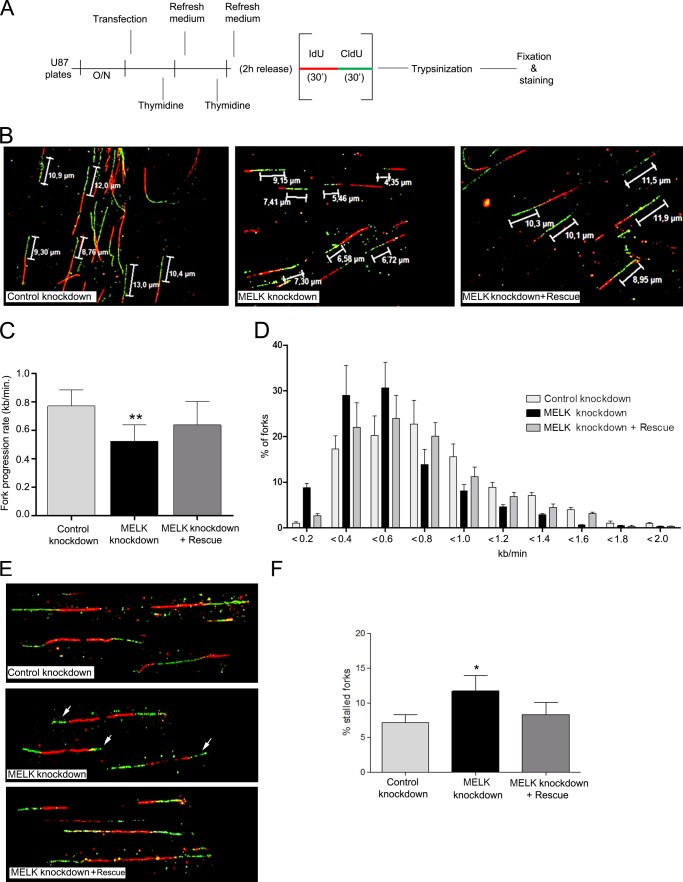
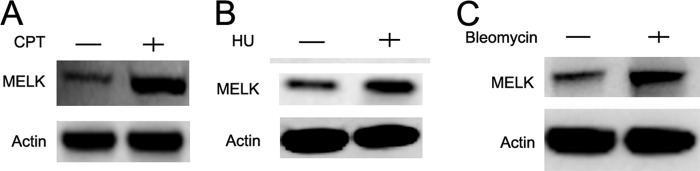
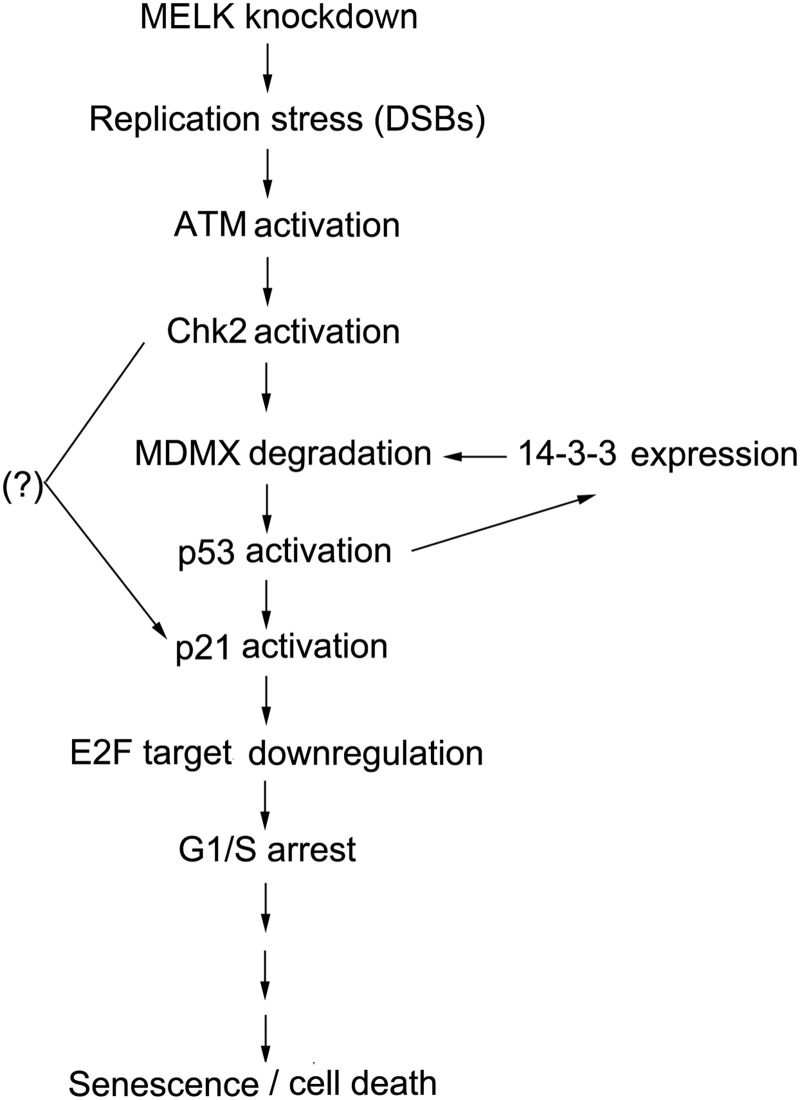
Maternal embryonic leucine zipper kinase (MELK) belongs to the subfamily of AMP-activated Ser/Thr protein kinases. The expression of MELK is very high in glioblastoma-type brain tumors, but it is not clear how this contributes to tumor growth. Here we show that the siRNA-mediated loss of MELK in U87 MG glioblastoma cells causes a G1/S phase cell cycle arrest accompanied by cell death or a senescence-like phenotype that can be rescued by the expression of siRNA-resistant MELK. This cell cycle arrest is mediated by an increased expression of p21(WAF1/CIP1), an inhibitor of cyclin-dependent kinases, and is associated with the hypophosphorylation of the retinoblastoma protein and the down-regulation of E2F target genes. The increased expression of p21 can be explained by the consecutive activation of ATM (ataxia telangiectasia mutated), Chk2, and p53. Intriguingly, the activation of p53 in MELK-deficient cells is not due to an increased stability of p53 but stems from the loss of MDMX (mouse double minute-X), an inhibitor of p53 transactivation. The activation of the ATM-Chk2 pathway in MELK-deficient cells is associated with the accumulation of DNA double-strand breaks during replication, as demonstrated by the appearance of γH2AX foci. Replication stress in these cells is also illustrated by an increased number of stalled replication forks and a reduced fork progression speed. Our data indicate that glioblastoma cells have elevated MELK protein levels to better cope with replication stress during unperturbed S phase. Hence, MELK inhibitors hold great potential for the treatment of glioblastomas as such or in combination with DNA-damaging therapies.

Keywords: Cell Cycle; DNA Damage; Glioblastoma; MELK; Protein Kinases; Replication Stress; Senescence; p21/WAF1/CIP1.


Figures

FIGURE 1.
FIGURE 1.
The depletion of MELK triggers a cell cycle delay and a senescence-like phenotype. A, MELK and actin levels in lysates from U87 cells 48 h after transfection with GFP-MELK (-), control siRNA (Ctr), or MELK siRNAs I or II. B, histogram showing the cell phase distribution of U87 cells 48 h after transfection with GFP-MELK, control siRNA, or MELK siRNAs I and II. The results are expressed as mean ± S.E. (n = 3). *, p < 0.05. C, schematic of the adopted strategy for a prolonged knockdown of MELK. D, 3-(4,5-dimethylthiazol-2-yl)-2,5-diphenyltetrazolium bromide (MTT) assays of U87 cells after a knockdown of MELK for 7 days. O/N, overnight. The results are expressed as mean ± S.E. (n = 3). *, p < 0.05. E, representative images showing the enlarged and flattened phenotype of U87 cells 7 days after the knockdown of MELK according to the procedure outlined in C. The cells were stained for β-galactosidase (blue). F, the percentage of the β-galactosidase-positive cells. The results are expressed as mean ± S.E. (n = 3). *, p < 0.05. G, histogram showing the effect of a transfection for 48 and 96 h with control siRNA or Melk siRNA I on the percentage of dead cells, as revealed by trypan blue staining. The results are expressed as mean ± S.E. (n = 3) *, p < 0.05.
FIGURE 2.
FIGURE 2.
MELK is required for efficient progression through S phase. A, FACS analysis of cell cycle distribution and BrdU incorporation in U87 cells before and 4 h after the release from a double thymidine block. The cells were harvested 48 h after transfection with control siRNA, MELK siRNA I or II, MELK siRNA I + FLAG-MELK (Rescue), or kinase-dead EGFP-MELK (MELK-D150A). B, histogram showing the cell phase distribution of U87 cells that were treated as explained in A. The results are expressed as percentage changes (mean ± S.E., n = 3) compared with the control knockdown. *, p < 0.05. C, histogram showing the percentage of BrdU-positive U87 cells that were treated as explained in A. The results are expressed as mean ± S.E. (n = 3). *, p < 0.05. D, immunoblot analyses of lysates from U87 cells treated as explained in A. Ctr, control; KD, knockdown.
FIGURE 3.
FIGURE 3.
A depletion of MELK activates the p21/Rb pathway. A, representative immunoblot analyses for the indicated proteins in cell lysates from U87 cells that had been transfected for 48 h with control siRNA (Ctr), MELK siRNA (MELK), or MELK siRNA + an expression vector for EGFP-MELK (Rescue). B, quantitation of the data for experiments as shown in A. The data are presented as percentage changes (mean ± S.E., n = 3 independent experiments) compared with the control knockdown and normalized against the expression level of actin, except for Rb-S807/811ph, which was normalized against Rb (total). *, p < 0.05. C, validation of the MELK knockdown with three different siRNAs showing an increased p21 level.
FIGURE 4.
FIGURE 4.
The MELK depletion-induced up-regulation of p21 is p53-dependent. A, representative immunoblot analyses for the indicated proteins in cell lysates from U87 and U251 cells that had been transfected for 48 h with control siRNA (Ctr) or MELK siRNA I (MELK). B, quantitation of the data for experiments as shown in A. The data are presented as percentage changes (mean ± S.E., n = 3 independent experiments) compared with the control knockdown and normalized against the expression level of actin.*, p < 0.05. C, representative immunoblot analyses for the indicated proteins in cell lysates from MCF7 and HeLa cells that had been transfected for 48 h with control siRNA or MELK siRNA I. D, quantitation of the data for experiments as shown in C. The data are presented as percentage changes (mean ± S.E., n = 3 independent experiments) compared with the control knockdown and normalized against the expression level of actin. *, p < 0.05.
FIGURE 5.
FIGURE 5.
The induction of p21 by the loss of MELK involves the ATM/Chk2/p53 pathway. A, immunoblot analyses of the indicated proteins in lysates from U87 cells that had been transfected for 48 h with control siRNA (Ctr), MELK siRNA (MELK), or MELK siRNA + an expression vector for EGFP-MELK (Rescue). B, quantitation of blots from three independent experiments as illustrated in A. The data are presented as percentage changes (mean ± S.E., n = 3) compared with the control knockdown and normalized against the expression level of actin. *, p < 0.05. C, representative immunoblot analyses of the indicated proteins in lysates from U87 cells after transfection with control or MELK siRNAs and after being treated or not treated with the ATM/ATR inhibitor CGK733 (10 μm for 12 h). D, quantitation of blots from three independent experiments as illustrated in D. The data are presented as percentage changes (mean ± S.E., n = 3) compared with the control knockdown and normalized against the expression level of actin. *, p < 0.05. E, immunoblot analyses of lysates from U87 cells after transfection for 48 h with the indicated siRNAs. F, quantitation of blots from three independent experiments as illustrated in E. The data are presented as percentage changes (mean ± S.E., n = 3) compared with the control knockdown and normalized against the expression level of actin. *, p < 0.05. G, representative immunoblot analyses for the indicated proteins in lysates from U87 cells 48 h after transfection with the indicated siRNAs or siRNA-resistant EGFP-MELK expression vector. H, quantitation of blots from three independent experiments as illustrated in G. The data are presented as percentage changes in Chk1-S317ph (mean ± S.E., n = 3) compared with the total level of Chk1.
FIGURE 6.
FIGURE 6.
A loss of MELK causes the accumulation of γH2AX foci. A, schematic of the procedure used to synchronize U87 cells in early G1 phase. The cells were incubated with BrdU (30 μg/ml) for 45 min before fixation. O/N, overnight. B, representative images from confocal microscopy showing γH2AX, BrdU, and DAPI staining in cells treated as illustrated in A and with the indicated transfections 48 h before fixation. C, schematic of the procedure used to synchronize U87 cells in S phase. The cells were incubated with BrdU (30 μg/ml) for 45 min before fixation. D, same as in B but for S phase cells. E, schematic of the procedure used to obtain asynchronized U87 cells. The cells were incubated with BrdU (30 μg/ml) for 45 min before fixation. F, same as in B but for asynchronized cells. G, quantification of the number of γH2AX-positive cells (percentage of total). At least 500 cells were counted for each condition, and the results were calculated for three independent experiments. Cells with ≥ 5 foci were considered γH2AX-positive. The results are expressed as mean ± S.E. (n = 3). *, p < 0.05.
FIGURE 7.
FIGURE 7.
MELK affects replication fork dynamics. A, schematic adopted to study replication fork dynamics in U87 cells. O/N, overnight. B, visualization of replication fork progression in U87 cells 48 h after transfection with the indicated plasmids. Shown are representative confocal images of signals derived from the successive pulse labeling with IdU (red) and CldU (green). Measurements were made with Leica (Las Af Lite) software. C, quantitation of the fork progression rate in the indicated conditions, expressed as kb/min. At least 500 fibers were counted for each condition in three independent experiments. The results are expressed as mean ± S.E. **, p < 0.001. D, distribution of the fork rates among the fiber populations in the indicated conditions. At least 500 fibers were counted for each condition in three independent experiments. The results are expressed as mean ± S.E. E, confocal images showing stalled forks, identified as asymmetrical signals within a replication unit. Fork arrest events are indicated with white arrows. F, quantitation of stalled forks (ratio of stalled forks/number of ongoing forks × 100). At least 70 replication units were counted for each condition in three independent experiments. The results are expressed as mean ± S.E. *, p < 0.05.
FIGURE 8.
FIGURE 8.
MELK is up-regulated during replication stress. A, thymidine-blocked U87 cells were released for 1 h and subsequently incubated for an additional hour without (-) or with (+) 10 μm camptothecin (CPT). Shown are immunoblot analyses of the lysates. B, same as in A but incubation without (-) or with (+) 1 mm hydroxyurea (HU) for 1 h. C, asynchronous U87 cells were incubated without (-) or with (+) bleomycin (10 μg/ml) for 2 h. Shown are immunoblot analyses of the lysates.
FIGURE 9.
FIGURE 9.
Model of the signaling pathway that is activated in response to a knockdown of MELK. A loss of MELK results in the accumulation of double-strand breaks during S phase. This leads to the activation of the ATM-Chk2-p53 pathway, which causes a cell cycle delay through p21-mediated inhibition of S phase Cdks and, eventually, a cell cycle arrest and a senescence-like phenotype.

Similar articles

Cited by

References

    1. Lizcano J. M., Göransson O., Toth R., Deak M., Morrice N. A., Boudeau J., Hawley S. A., Udd L., Mäkelä T. P., Hardie D. G., Alessi D. R. (2004) LKB1 is a master kinase that activates 13 kinases of the AMPK subfamily, including MARK/PAR-1. EMBO J. 23, 833–843 - PMC - PubMed
    1. Beullens M., Vancauwenbergh S., Morrice N., Derua R., Ceulemans H., Waelkens E., Bollen M. (2005) Substrate specificity and activity regulation of protein kinase MELK. J. Biol. Chem. 280, 40003–40011 - PubMed
    1. Badouel C., Körner R., Frank-Vaillant M., Couturier A., Nigg E. A., Tassan J. P. (2006) M-phase MELK activity is regulated by MPF and MAPK. Cell Cycle 8, 883–889 - PubMed
    1. Verlinden L., Eelen G., Beullens I., Van Camp M., Van Hummelen P., Engelen K., Van Hellemont R., Marchal K., De Moor B., Foijer F., Te Riele H., Beullens M., Bollen M., Mathieu C., Bouillon R., Verstuyf A. (2005) Characterization of the condensin component Cnap1 and protein kinase MELK as novel E2F target genes down-regulated by 1,25-dihydroxyvitamin D3. J. Biol. Chem. 280, 37319–37330 - PubMed
    1. Badouel C., Chartrain I., Blot J., Tassan J. P. (2010) Maternal embryonic leucine zipper kinase is stabilized in mitosis by phosphorylation and is partially degraded upon mitotic exit. Exp. Cell Res. 316, 2166–2173 - PubMed

Publication types

MeSH terms