. 2013 Oct;12(10):2724-34.
doi: 10.1074/mcp.M113.030700. Epub 2013 Jul 8.

Specific glycoforms of MUC5AC and endorepellin accurately distinguish mucinous from nonmucinous pancreatic cysts

Affiliations

Specific glycoforms of MUC5AC and endorepellin accurately distinguish mucinous from nonmucinous pancreatic cysts

Zheng Cao et al. Mol Cell Proteomics. 2013 Oct.

Abstract

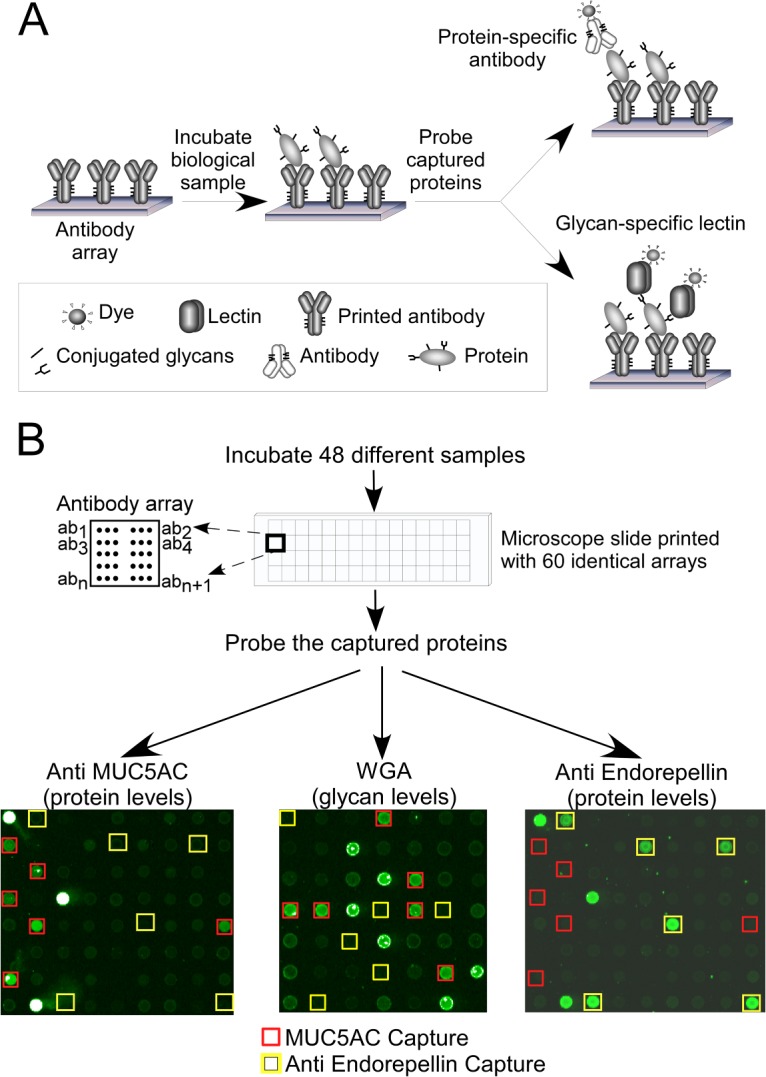
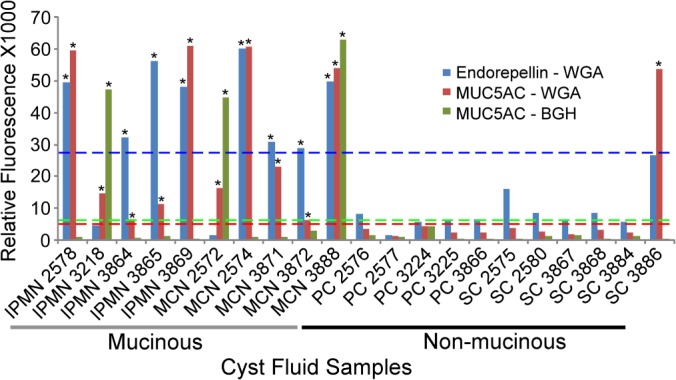
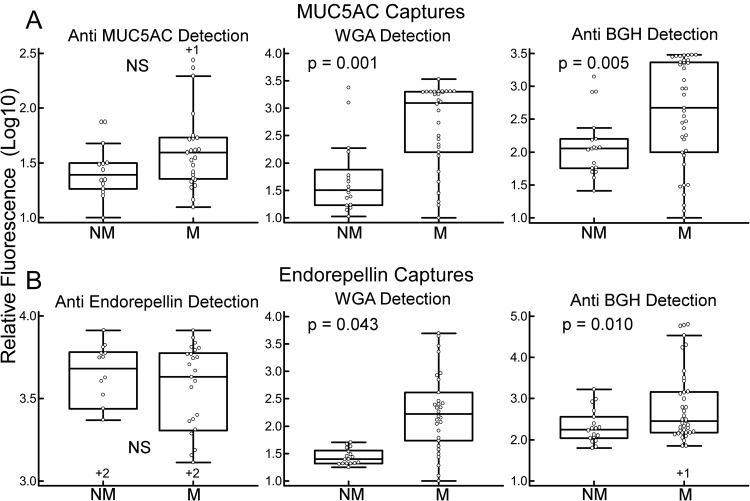
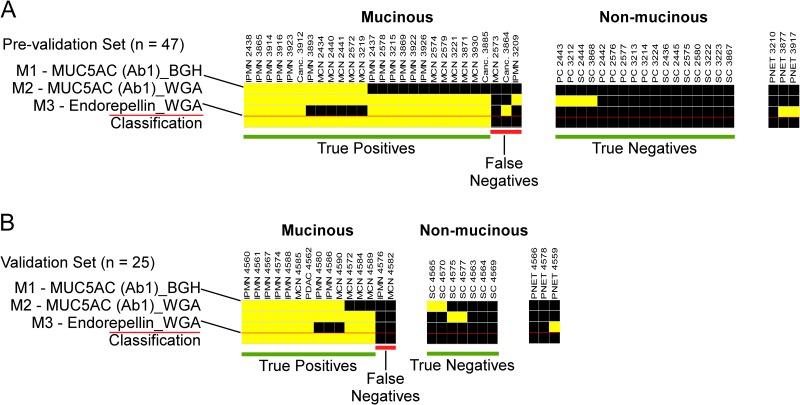
Specific protein glycoforms may be uniquely informative about the pathological state of a cyst and may serve as accurate biomarkers. Here we tested that hypothesis using antibody-lectin sandwich arrays in broad screens of protein glycoforms and in targeted studies of candidate markers. We profiled 16 different glycoforms of proteins captured by 72 different antibodies in cyst fluid from mucinous and nonmucinous cysts (n = 22), and we then tested a three-marker panel in 22 addition samples and 22 blinded samples. Glycan alterations were not widespread among the proteins and were mainly confined to MUC5AC and endorepellin. Specific glycoforms of these proteins, defined by reactivity with wheat germ agglutinin and a blood group H antibody, were significantly elevated in mucinous cysts, whereas the core protein levels were not significantly elevated. A three-marker panel based on these glycoforms distinguished mucinous from nonmucinous cysts with 93% accuracy (89% sensitivity, 100% specificity) in a prevalidation sample set (n = 44) and with 91% accuracy (87% sensitivity, 100% specificity) in independent, blinded samples (n = 22). Targeted lectin measurements and mass spectrometry analyses indicated that the higher wheat germ agglutinin and blood group H reactivity was due to oligosaccharides terminating in GlcNAc or N-acetyl-lactosamine with occasional α1,2-linked fucose. The results show that MUC5AC and endorepellin glycoforms may be highly specific and sensitive biomarkers for the differentiation of mucinous from nonmucinous pancreatic cysts.


Figures

Fig. 1.
Fig. 1.
Detection of individual proteins' abundances and glycoforms. A, the proteins captured by an antibody array may be probed with either an antibody, to measure the abundance of the core protein, or a lectin, to measure the glycans on the captured proteins. B, multiple, identical arrays may be run on a single microscope slide for high-throughput and low-volume sample processing. The probing of an array with anti-MUC5AC or anti-endorepellin antibody shows signals only at the anti-MUC5AC or anti-endorepellin capture spots, respectively, but probing the array with WGA shows signals at several capture antibodies. The brightest spots in each array (with white pixels indicating saturation of signal) are biotinylated positive-control proteins that were not used in the analysis.
Fig. 2.
Fig. 2.
A three-marker panel for distinguishing mucinous from nonmucinous cysts. An elevation of two or more of the three markers (as defined by the threshold for each marker) was observed in all of the mucinous cyst samples (intraductal papillary mucinous neoplasms (IPMNs) and mucinous cystic neoplasms (MCNs)) but in none of the nonmucinous cyst samples (serous cystadenomas (SCs) and pseudocysts (PCs)). An asterisk above a bar indicates a measurement that was above its respective threshold. The dashed lines are the thresholds for the respective markers, with colors matched between the dashed lines and the marker data.
Fig. 3.
Fig. 3.
Protein and glycan levels of MUC5AC and endorepellin. The plots show quantified, logged fluorescence values from the anti-MUC5AC (Ab1) (A) and anti-endorepellin (B) capture antibodies. Probing the anti-MUC5AC capture antibody with an anti-MUC5AC (Ab1) detection antibody (upper left) gives the MUC5AC protein levels, and anti-endorepellin detection at the anti-endorepellin capture antibody (same antibody for capture and detection) gives the endorepellin protein levels (lower left). Detection by WGA and anti-BGH gives the respective glycan levels at each capture antibody. Each point is the average signal from triplicate arrays for an individual sample, and results from 44 samples are shown. The boxes give the upper and lower quartiles, the vertical and narrow horizontal lines define the signal range (including data that are between the 1.5 interquartile range (IQR) of the lower quartile and the 1.5 IQR of the upper quartile), and the wide horizontal lines mark the median values. The +1 or +2 signs above or below some of the box plots indicate the number of data points that are outside the range of the display. We calculated the p values using the two-tailed t test on the unlogged values. M, mucinous; NM, nonmucinous; NS, not significant.
Fig. 4.
Fig. 4.
Performance of the three-marker panel in independent sample sets. A, the three-marker panel was applied to 44 cyst fluid samples (27 mucinous, 17 nonmucinous, and 3 PNETs). Each column represents results from a sample, and the first three rows indicate each marker value. A yellow square indicates that the marker exceeded the threshold, and a black square indicates that it was below the threshold. The bottom row indicates the classification. If two or more markers were elevated, a sample was classified as mucinous (yellow square); otherwise it was classified as nonmucinous (black square). The sample columns were grouped by marker pattern for clarity. B, the panel was applied blinded to 25 cyst fluid samples (15 mucinous, 7 nonmucinous, and 3 PNETs) that had not been used for marker development. Note the similarity in subgroups of marker patterns between panels A and B.

References

    1. Matthaei H., Schulick R. D., Hruban R. H., Maitra A. (2011) Cystic precursors to invasive pancreatic cancer. Nat. Rev. Gastroenterol. Hepatol. 8, 141–150 - PMC - PubMed
    1. van der Waaij L. A., van Dullemen H. M., Porte R. J. (2005) Cyst fluid analysis in the differential diagnosis of pancreatic cystic lesions: a pooled analysis. Gastrointest. Endosc. 62, 383–389 - PubMed
    1. Brugge W. R., Lewandrowski K., Lee-Lewandrowski E., Centeno B. A., Szydlo T., Regan S., del Castillo C. F., Warshaw A. L. (2004) Diagnosis of pancreatic cystic neoplasms: a report of the cooperative pancreatic cyst study. Gastroenterology 126, 1330–1336 - PubMed
    1. Nagula S., Kennedy T., Schattner M. A., Brennan M. F., Gerdes H., Markowitz A. J., Tang L., Allen P. J. (2010) Evaluation of cyst fluid CEA analysis in the diagnosis of mucinous cysts of the pancreas. J. Gastrointest. Surg. 12, 1997–2003 - PubMed
    1. Khalid A., Zahid M., Finkelstein S. D., LeBlanc J. K., Kaushik N., Ahmad N., Brugge W. R., Edmundowicz S. A., Hawes R. H., McGrath K. M. (2009) Pancreatic cyst fluid DNA analysis in evaluating pancreatic cysts: a report of the panda study. Gastrointest. Endosc. 69, 1095–1102 - PubMed

Publication types