

Addressing geographic disparities in liver transplantation through redistricting
- PMID: 23837931
- PMCID: PMC4674218
- DOI: 10.1111/ajt.12301
Addressing geographic disparities in liver transplantation through redistricting
Abstract
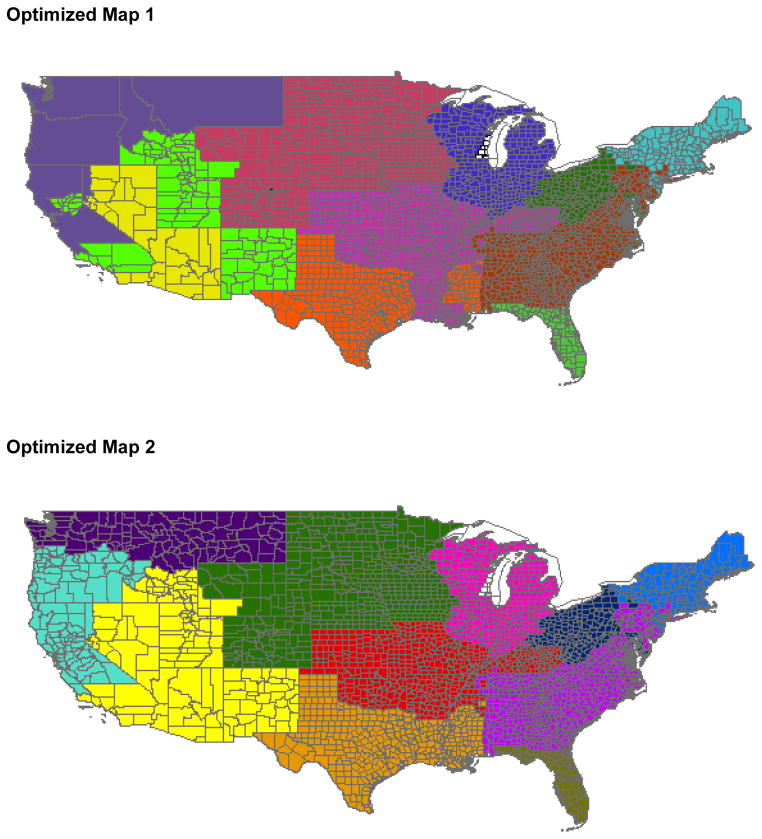
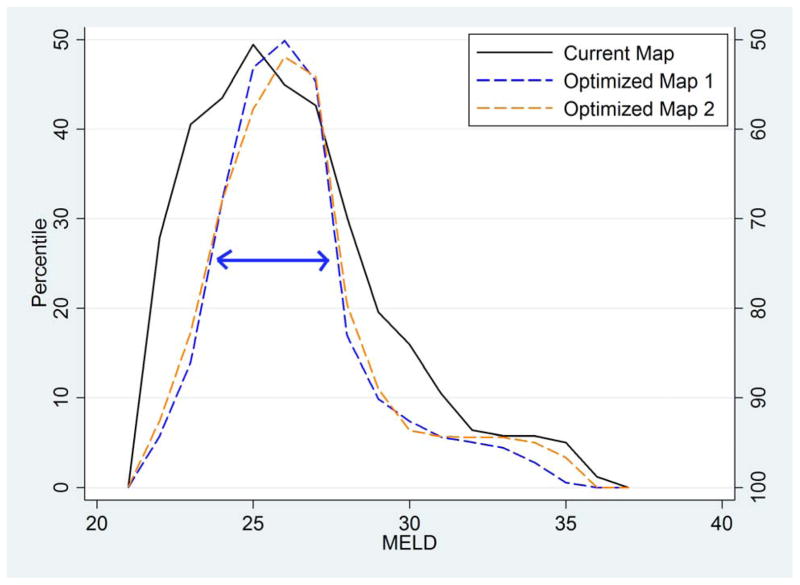
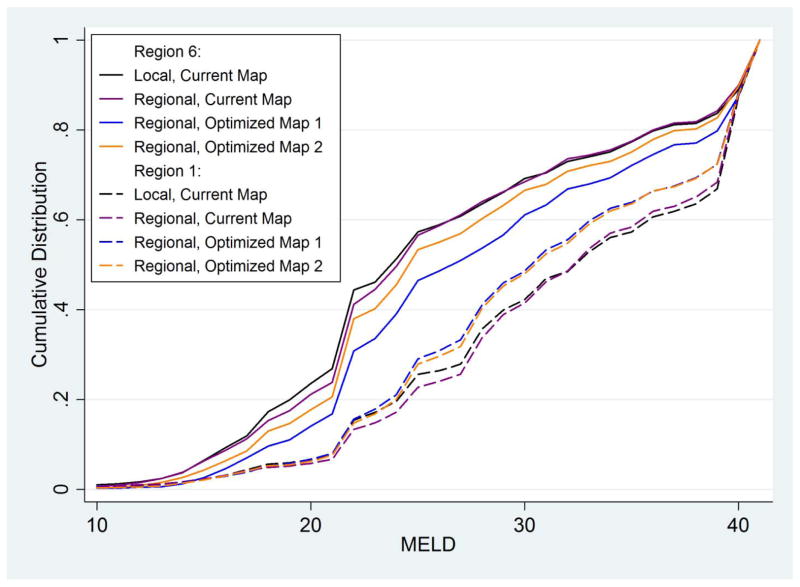
Severe geographic disparities exist in liver transplantation; for patients with comparable disease severity, 90-day transplant rates range from 18% to 86% and death rates range from 14% to 82% across donation service areas (DSAs). Broader sharing has been proposed to resolve geographic inequity; however, we hypothesized that the efficacy of broader sharing depends on the geographic partitions used. To determine the potential impact of redistricting on geographic disparity in disease severity at transplantation, we combined existing DSAs into novel regions using mathematical redistricting optimization. Optimized maps and current maps were evaluated using the Liver Simulated Allocation Model. Primary analysis was based on 6700 deceased donors, 28 063 liver transplant candidates, and 242 727 Model of End-Stage Liver Disease (MELD) changes in 2010. Fully regional sharing within the current regional map would paradoxically worsen geographic disparity (variance in MELD at transplantation increases from 11.2 to 13.5, p = 0.021), although it would decrease waitlist deaths (from 1368 to 1329, p = 0.002). In contrast, regional sharing within an optimized map would significantly reduce geographic disparity (to 7.0, p = 0.002) while achieving a larger decrease in waitlist deaths (to 1307, p = 0.002). Redistricting optimization, but not broader sharing alone, would reduce geographic disparity in allocation of livers for transplant across the United States.
Keywords: Broader sharing; Liver Simulated Allocation Model; geographic disparities; liver allocation.
© Copyright 2013 The American Society of Transplantation and the American Society of Transplant Surgeons.
Conflict of interest statement
The authors of this manuscript have no conflicts of interest to disclose as described by the
Figures
Comment in
-
Deceased donor liver allocation: cutting the Gordian knot.Am J Transplant. 2013 Aug;13(8):1949-50. doi: 10.1111/ajt.12302. Am J Transplant. 2013. PMID: 23890283 No abstract available.
References
-
-
Organ Procurement and Transplantation Network Final Rule, CFR 42.1.K.121. In. US, 1998.
-
-
- Ubel PA, Caplan AL. Geographic favoritism in liver transplantation--unfortunate or unfair? N Engl J Med. 1998;339(18):1322–1325. - PubMed
Publication types
MeSH terms
Grants and funding
LinkOut - more resources
Full Text Sources
Other Literature Sources
Medical
