. 2013 Dec;17(8):929-45.
doi: 10.1016/j.media.2013.05.004. Epub 2013 May 23.

Joint segmentation of anatomical and functional images: applications in quantification of lesions from PET, PET-CT, MRI-PET, and MRI-PET-CT images

Affiliations

Joint segmentation of anatomical and functional images: applications in quantification of lesions from PET, PET-CT, MRI-PET, and MRI-PET-CT images

Ulas Bagci et al. Med Image Anal. 2013 Dec.

Abstract

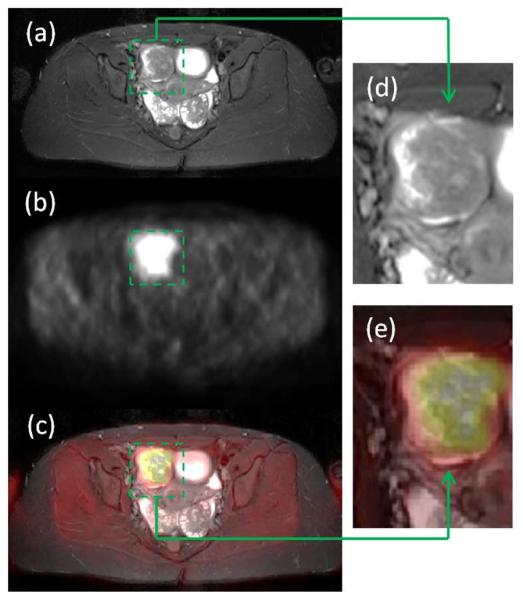
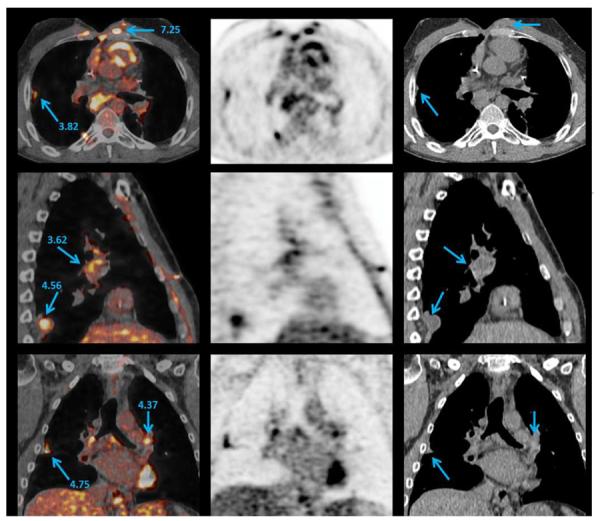
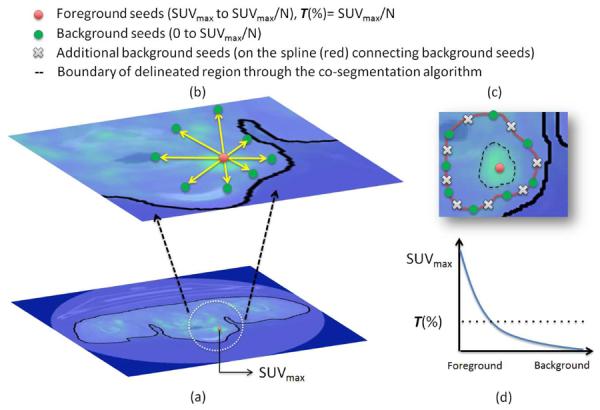
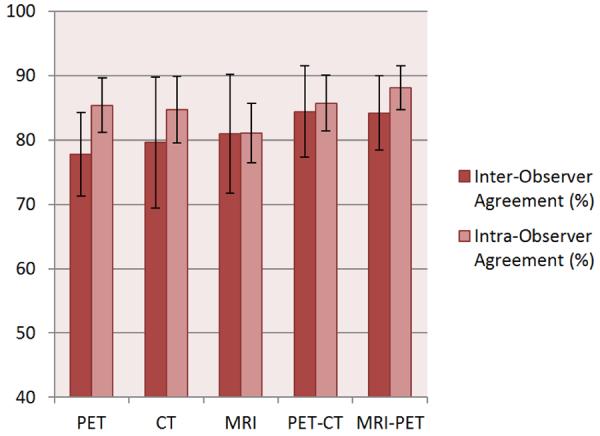
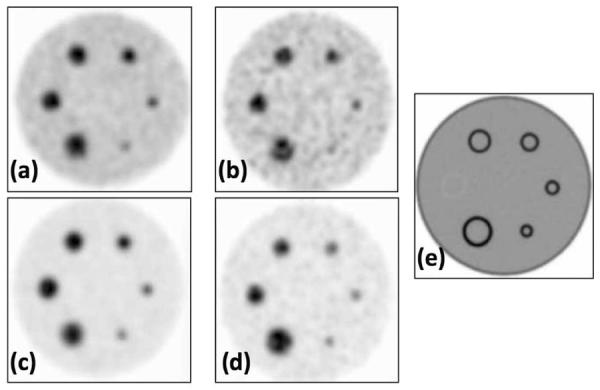
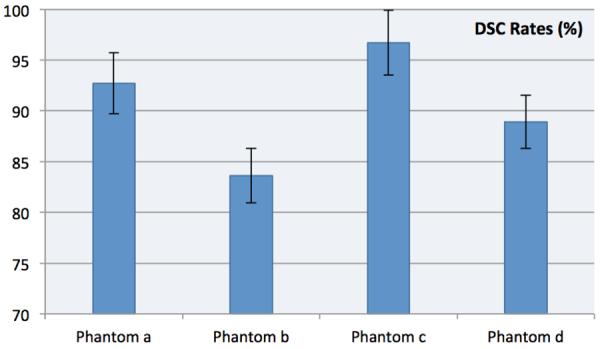
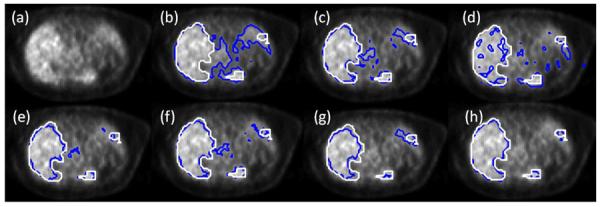
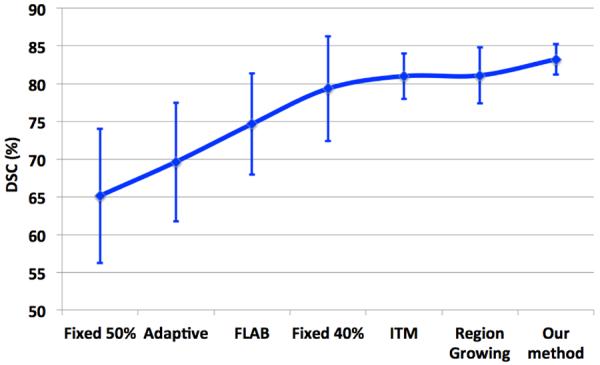
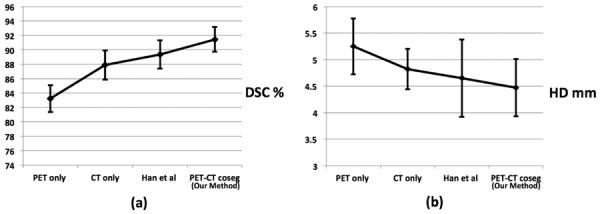
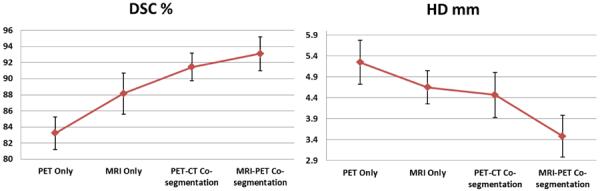
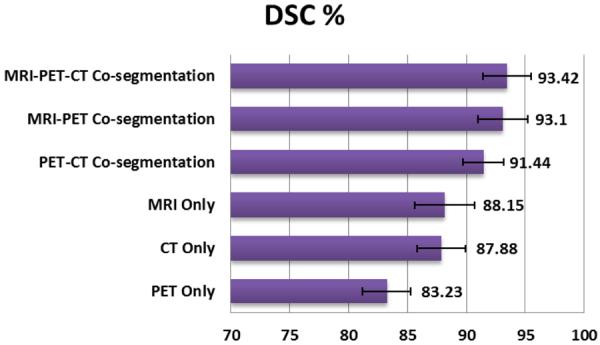
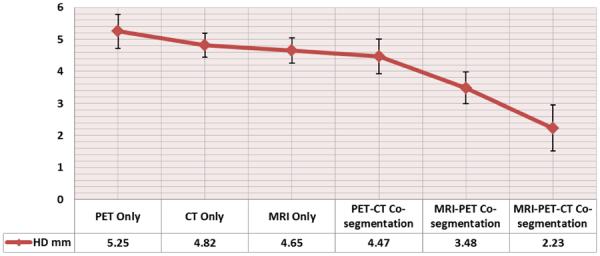
We present a novel method for the joint segmentation of anatomical and functional images. Our proposed methodology unifies the domains of anatomical and functional images, represents them in a product lattice, and performs simultaneous delineation of regions based on random walk image segmentation. Furthermore, we also propose a simple yet effective object/background seed localization method to make the proposed segmentation process fully automatic. Our study uses PET, PET-CT, MRI-PET, and fused MRI-PET-CT scans (77 studies in all) from 56 patients who had various lesions in different body regions. We validated the effectiveness of the proposed method on different PET phantoms as well as on clinical images with respect to the ground truth segmentation provided by clinicians. Experimental results indicate that the presented method is superior to threshold and Bayesian methods commonly used in PET image segmentation, is more accurate and robust compared to the other PET-CT segmentation methods recently published in the literature, and also it is general in the sense of simultaneously segmenting multiple scans in real-time with high accuracy needed in routine clinical use.

Keywords: MRI-PET Co-segmentation; PET segmentation; PET-CT Co-segmentation; Random Walk; Simultaneous segmentation.


Figures

Figure 1
Figure 1
A patient (aged 28, female) with paragangliomas tumor is shown at (a) MRI, (b) PET, and (c) MRI-PET scans. Note that simiultaneous MRI-PET imaging provides anatomical and functional information fused into the same space without needing a registration. Zoomed tumor sites from (a) and (c) are shown in (d) and (e), respectively.
Figure 2
Figure 2
PET-CT (first column), PET (second column), and CT (third column) images are shown in axial, sagittal, and coronal view in the first, second, and third rows, respectively. SUVmax of different uptake regions is indicated by blue arrows. CT images usually do not show anatomically abnormal appearance even though high SUVmax is observed at PET.
Figure 3
Figure 3
The concepts of interesting uptake region (IUR) detection and background/foreground seed localization are sketched in (a–d). Green markers are connected by b-splines (c) and additional background seeds (indicated by white markers) are located on the b-splines connecting background seeds (c). The resulting co-segmentation from the localized seeds is shown as a dashed curve in (c).
Figure 4
Figure 4
Inter- and intra-observer agreements at manual segmentation are plotted for different imaging modalities. Observer agreement improves when functional and anatomical images are combined during tracing.
Figure 5
Figure 5
PET phantom images (a–d) with CT acquisition ground truth (e). Phantoms have the following SBRs and voxel sizes: (a) 4 : 1, 8 mm3, (b) 4 : 1, 64 mm3, (c) 8 : 1, 8 mm3, (d) 8 : 1, 64 mm3.
Figure 6
Figure 6
DSC rates obtained over IEC phantoms (a–d). Phantoms have the following SBRs and voxel sizes: (a) 4 : 1, 8 mm3, (b) 4 : 1, 64 mm3, (c) 8 : 1, 8 mm3, (d) 8 : 1, 64 mm3.
Figure 7
Figure 7
Segmented uptake regions (blue) and ground truth (white) are shown for different segmentation methods for the PET image slice at (a). 40% fixed thresholding (b), 50% fixed thresholding (c), adaptive Otsu thresholding (d), ITM (e), region growing (f), FLAB (g), and our proposed method (h).
Figure 8
Figure 8
DSC comparison of the proposed technique to the methods commonly used in the literature in segmentation of PET images. The proposed method is statistically significantly different from others (p<1.1e–4 in all cases).
Figure 9
Figure 9
Three different segmentation examples of uptake regions are shown in each column. First column: the proposed co-segmentation (blue) and ground truth (black) are overlaid. Second column: ground truth (black) and segmentation from PET only (yellow). Third column: ground truth (black) and segmentation from CT only (green). Fourth column: all segmentations and ground truth are overlaid together.
Figure 10
Figure 10
Mean DSCs (a) and HDs (b) are listed.
Figure 11
Figure 11
The same patient underwent both PET-CT and MRI-PET within two days. One particular slice is shown from (a) PET image of PET-CT, (b) CT image of PET-CT, (c) PET-CT co-segmentation, (d) PET image of MRI-PET, (e) MRI image of MRI-PET scans is shown, and (f) MRI-PET co-segmentation. The proposed co-segmentation method jointly delineates uptake regions from PET images and abnormal tissue regions from corresponding structural images simultaneously (white lines in c and f). Two expert observers' drawings are shown as surrogate of truth (blue and green). Segmented regions from PET-CT and MRI-PET images are rendered and overlaid in (g) (white and blue, respectively).
Figure 12
Figure 12
Mean DSCs (left) and HDs (right) are graphed. DSCs.
Figure 13
Figure 13
Mean DSCs in the comparison of different scenarios.
Figure 14
Figure 14
Mean HDs in the comparison of different scenarios.
Figure 15
Figure 15
DSC values as a function of N in co-segmentation experiments conducted on PET-CT scans. The best DSC values are obtained when N ≈ 2.
Figure 16
Figure 16
(a) For each foreground seed (yellow), search in 8-directions is conducted to find the first corresponding background seeds (red). (b) These background seeds are connected through a spline curve and spels lying on the spline are also added to the pool of background seeds.
Figure 17
Figure 17
Ground truth segmentation (black) and the random walk segmentation (green) with and without using additional background seeds are shown. (a) Leakage may occur due to the close proximity of normal and abnormal tissues when a limited number of background seeds was used. (b) Leakage can be avoided by using the additional background seeds. Seeds are obtained from PET correspondence of the CT scan.
Figure 18
Figure 18
Various seeding examples are shown for different anatomical levels from different subject's PET images. Red: foreground seeds, green: background seeds.
Figure 19
Figure 19
Sensitivity analysis of the co-segmentation method with manual seeding.
Figure 20
Figure 20
Abnormal regions from anatomical and functional images may show low to high variations. PET, MRI, and PET-MRI images with small variability across scans (left arrow), and intermediate variability (right arrow) are shown in (a–c and g–i). Large variability between functional and anatomical structures is observed in (d–f).

References

    1. Bagci U, Bai L. SIBGRAPI XX Brazilian Symposium on Computer Graphics and Image Processing. 2007. Multiresolution elastic medical image registration in standard intensity scale; pp. 305–312.
    1. Bagci U, Bai L. Proc. of SPIE Medical Imaging. 2008. Registration of standardized histological images in feature space; pp. 69142V–1.
    1. Bagci U, Bai L. Automatic best reference slice selection for smooth volume reconstruction of a mouse brain from histological images. IEEE Transactions on Medical Imaging. 2010;29:1688–1696. - PubMed
    1. Bagci U, Bray M, Caban J, Yao J, Mollura D. Computer-assisted detection of infectious lung diseases: a review. Computerized medical imaging and graphics. 2012a;36:72–84. - PMC - PubMed
    1. Bagci U, Udupa J, Yao J, Mollura D. Proc. of Medical Image Computing and Computer-Assisted Intervention. 2012b. Co-segmentation of functional and anaotmical images; pp. 459–467. - PMC - PubMed

Publication types

MeSH terms