. 2013 Sep 15;19(18):5079-91.
doi: 10.1158/1078-0432.CCR-13-0955. Epub 2013 Jul 9.

Generation of tumor antigen-specific T cell lines from pediatric patients with acute lymphoblastic leukemia--implications for immunotherapy

Affiliations

Generation of tumor antigen-specific T cell lines from pediatric patients with acute lymphoblastic leukemia--implications for immunotherapy

Gerrit Weber et al. Clin Cancer Res. .

Abstract

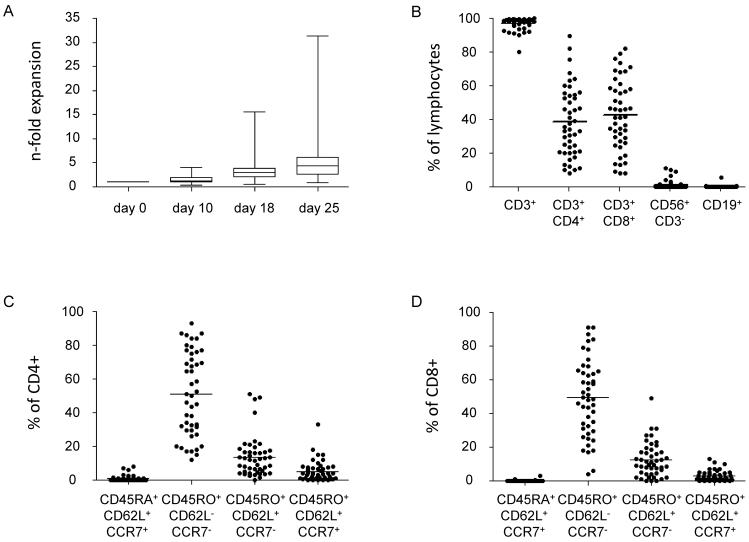
Purpose: Although modern cure rates for childhood acute lymphoblastic leukemia (ALL) exceed 80%, the outlook remains poor in patients with high-risk disease and those who relapse, especially when allogeneic hematopoietic stem cell transplantation is not feasible. Strategies to improve outcome and prevent relapse are therefore required. Immunotherapy with antigen-specific T cells can have antileukemic activity without the toxicities seen with intensive chemotherapy, and therefore represents an attractive strategy to improve the outcome of high-risk patients with ALL. We explored the feasibility of generating tumor antigen-specific T cells ex vivo from the peripheral blood of 50 patients with ALL [26 National Cancer Institute (NCI) high-risk and 24 standard-risk] receiving maintenance therapy.

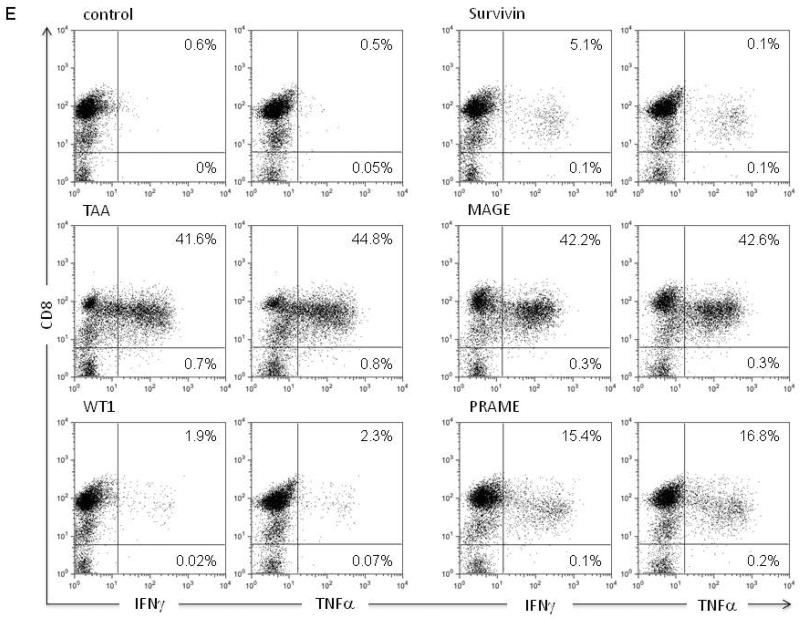
Experimental design: Peripheral blood mononuclear cells were stimulated with autologous dendritic cells pulsed with complete peptide libraries of WT1, Survivin, MAGE-A3, and PRAME, antigens frequently expressed on ALL blasts.

Results: T-cell lines were successfully expanded from all patients, despite low lymphocyte counts and irrespective of NCI risk group. Antigen-specificity was observed in more than 50% of patients after the initial stimulation and increased to more than 90% after three stimulations as assessed in IFN-γ-enzyme-linked immunospot (ELISpot) and (51)Cr-release assays. Moreover, tumor-specific responses were observed by reduction of autologous leukemia blasts in short- and long-term coculture experiments.

Conclusion: This study supports the use of immunotherapy with adoptively transferred autologous tumor antigen-specific T cells to prevent relapse and improve the prognosis of patients with high-risk ALL.


Figures

Figure 1
Figure 1. Expansion and Phenotype of T-cell lines
(A) N-fold (mean ± SD) expansion of antigen-specific T-cell lines (CTLs) generated from patients with ALL during maintenance therapy. Cell counts were assessed at the end of each re-stimulation on days 10, 18 and 25 of culture (n=50). (B) Phenotype of CTLs after the 3rd stimulation; gated on live lymphocytes. (C) T-cell subsets within the CD3+/CD4+ population. (D) T-cell subsets within the CD3+/CD8+ population.
Figure 2
Figure 2. Summary of antigen-specific responses in IFNγ-ELISpot and cytotoxicity assay
(A) Number of antigens recognized in IFNγ-ELISpot by CTLs generated from patients classified as standard risk (SR, n=24, left panel) or high risk (HR, n=26, right panel). (B) Percent of patients recognizing each of the 4 antigens or the mix of all antigens (TAA) used for T-cell generation in IFNγ-ELISpot assay (SR white bars, HR black bars). (C) Number of spot forming cells (SFC)/105 cells (mean ± SE) in SR (n=24, white bars) and HR (n=26, black bars) patients for each of the antigens and TAA. Responses were assessed after the 3rd stimulation. (D) Cytolytic activity in a standard 51Cr-release assay against peptide-pulsed autologous target cells (PHA-blasts) at an effector-to-target (E:T) ratio of 20:1 (mean ± SE; SR n=24, white bars, HR n=26, black bars).
Figure 3
Figure 3. HLA-restriction of antigen recognition in two T-cell lines
IFNγ-ELISpot responses during the course of 3 re-stimulation cycles against TAA after the initial stimulation (A) versus the 4 individual antigens after the 3rd stimulation (B). Epitope mapping for WT1 using a 15mer peptide library overlapping by 11 amino acids spanning the whole sequence of WT1 indicated recognition of two regions within the WT1 sequence: WT1 peptides #71 and #9. (C) IFNγ-secretion in response to peptides #71 can be inhibited by HLA-class I blocking antibody in ELISpot assay, which implies a CD8+-restricted recognition of this epitope. Autologous peptide-pulsed antigen presenting cells were used for stimulation or pre-incubated with blocking antibodies. (D) Peptide #9 recognition is reduced by HLA-class II blocking antibody indicating a CD4+-restricted recognition of this peptide. (Figures A–D: mean ± SD). (E) Intracellular detection of INFγ and TNFα after antigen stimulation in presence of co-stimulatory antibodies anti-CD28 and CD49d, Brefeldin and Monensin followed by intra- and extracellular antibody staining shows cytokine production at varying levels restricted to the CD8+ population. Plots shown are gated on live lymphocytes and CD3+ cells.
Figure 4
Figure 4. Reactivity of tumor antigen-specific T-cell lines against autologous leukemia cells
Summary of co-culture experiments of 8 patient-derived tumor antigen-specific T-cell lines (CTLs) against their autologous bone marrow leukemia blast samples cryopreserved at the time of diagnosis. Nonspecific T cells or unstimulated cells of the same patient were used as control in all experiments. (A) Summary of the IFNγ-ELISpot co-culture results of CTLs (n=8, black bar) vs. nonspecific T cells (n=8, white bar) (mean ± SE) at an E:T ratio of 1:1. (B) In a three-day co-culture at an E:T ratio of 10:1 leukemia cell counts were assessed by FACS analysis and compared to the absolute leukemia cell count obtained on day 0. Leukemia blasts were quantified by CD10 and CD19 co-staining; T cells were quantified by CD3 positivity. Absolute cell numbers were assessed by quantification with FACS counting beads and the percentage of remaining leukemia cells was calculated compared to cell numbers on day 0 (nonspecific T cells, control: white bars, CTLs: black bars) (mean ± SD). (C) IFNγ and IL4 ELISA of the co-culture supernatants after 24h (mean ± SE; control n=8, white bars, CTLs n=8, black bars). (D) Relative inhibition of colony formation of leukemic cells in CFU assays when co-cultured with CTLs (n=8, black bar) vs. nonspecific cells (n=8, white bar)(E:T ratio 10:1; mean ± SE).
Figure 5
Figure 5. Antigen recognition and reactivity against autologous leukemia cells in a patient with standard risk acute lymphoblastic leukemia
Antigen-specific CTLs of patient #1032 showed recognition of TAA after the initial stimulation (A), as well as recognition of PRAME and WT1 after the 3rd stimulation (B) in IFNγ-ELISpot (mean ± SD). (C) Cytolytic activity in a standard 51Cr-release assay against antigen-pulsed autologous target cells (PHA-blasts, PHAB) at E:T ratios from 40:1 to 1.2:1. (D) Percent of remaining leukemia cells in co-culture of CTLs with autologous leukemia blasts on day 1 and 3 in presence of IL2 (50U/ml) at an E:T ratio of 10:1. Leukemic cells were detected by co-staining with CD10 and CD19 antibodies, T cells by staining with CD3 antibody; nonspecific T cells (white bars) were used as control for unspecific lysis (CTLs: black bars). (E) Assessment of absolute leukemia cell counts in co-culture with CTLs (black line) and nonspecific T cells (dashed line) at an E:T ratio of 10:1 by FACS analysis using counting beads. (F) Co-culture at a 1:1 ratio of autologous leukemia cells to CTLs (black bar) or nonspecific T cells (white bar) in IFNγ-ELISpot assay (mean ± SD). (G) Immunohistochemistry of leukemia blasts.

References

    1. Kennedy-Nasser AA, Bollard CM, Myers GD, Leung KS, Gottschalk S, Zhang Y, et al. Comparable outcome of alternative donor and matched sibling donor hematopoietic stem cell transplant for children with acute lymphoblastic leukemia in first or second remission using alemtuzumab in a myeloablative conditioning regimen. Biol Blood Marrow Transplant. 2008 Nov;14(11):1245–52. - PubMed
    1. Eapen M, Zhang MJ, Devidas M, Raetz E, Barredo JC, Ritchey AK, et al. Outcomes after HLA-matched sibling transplantation or chemotherapy in children with acute lymphoblastic leukemia in a second remission after an isolated central nervous system relapse: a collaborative study of the Children's Oncology Group and the Center for International Blood and Marrow Transplant Research. Leukemia. 2008 Feb;22(2):281–6. - PubMed
    1. Kolb HJ, Schattenberg A, Goldman JM, Hertenstein B, Jacobsen N, Arcese W, et al. Graft-versus-leukemia effect of donor lymphocyte transfusions in marrow grafted patients. Blood. 1995 Sep 1;86(5):2041–50. - PubMed
    1. Porter DL, Orloff GJ, Antin JH. Donor mononuclear cell infusions as therapy for B-cell lymphoproliferative disorder following allogeneic bone marrow transplant. Transplant Sci. 1994 Sep;4(1):12–4. - PubMed
    1. Rabin KR, Gramatges MM, Borowitz MJ, Palla SL, Shi X, Margolin JF, et al. Absolute lymphocyte counts refine minimal residual disease-based risk stratification in childhood acute lymphoblastic leukemia. Pediatr Blood Cancer. 2012 Sep;59(3):468–74. - PMC - PubMed

Publication types

MeSH terms