

CD30 targeting with brentuximab vedotin: a novel therapeutic approach to primary effusion lymphoma
- PMID: 23838350
- PMCID: PMC3744990
- DOI: 10.1182/blood-2013-01-481713
CD30 targeting with brentuximab vedotin: a novel therapeutic approach to primary effusion lymphoma
Abstract
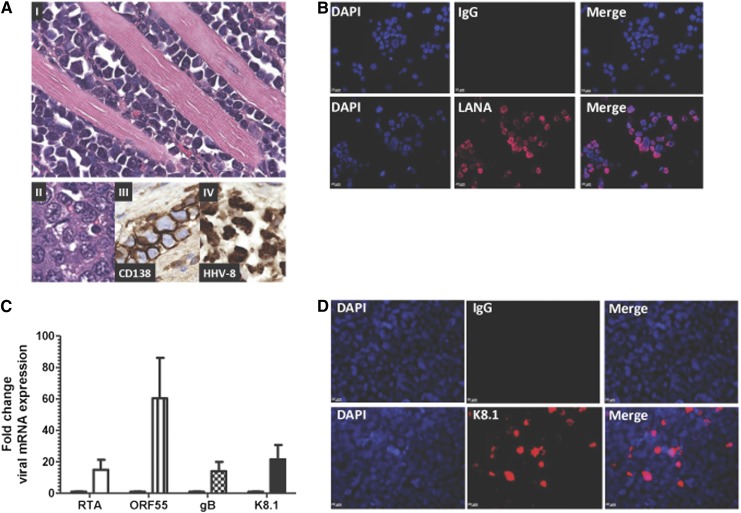
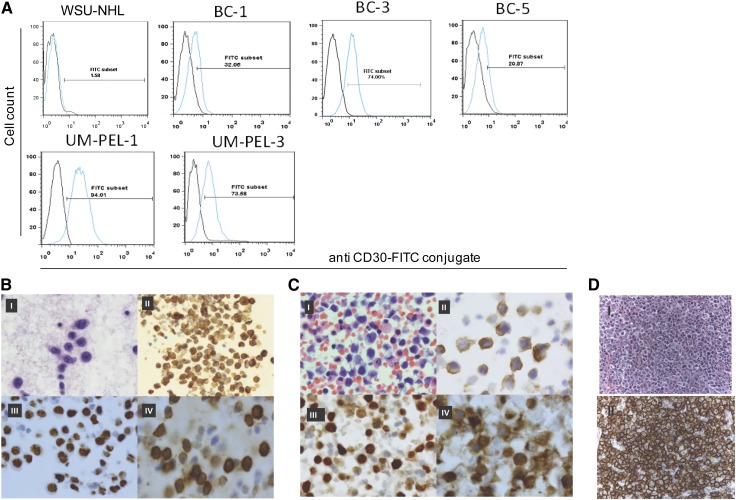
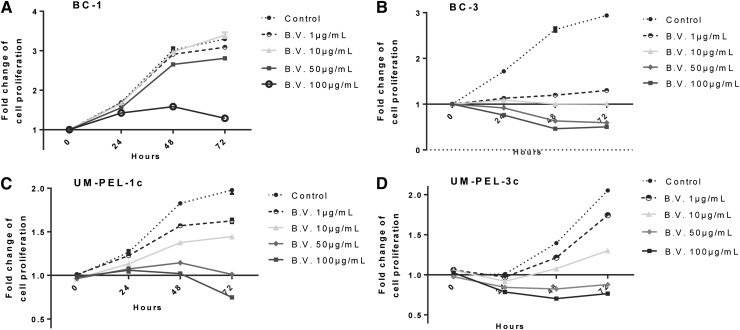
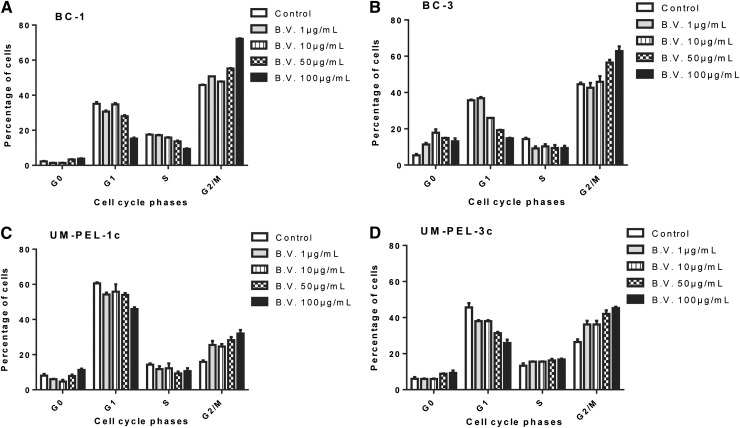
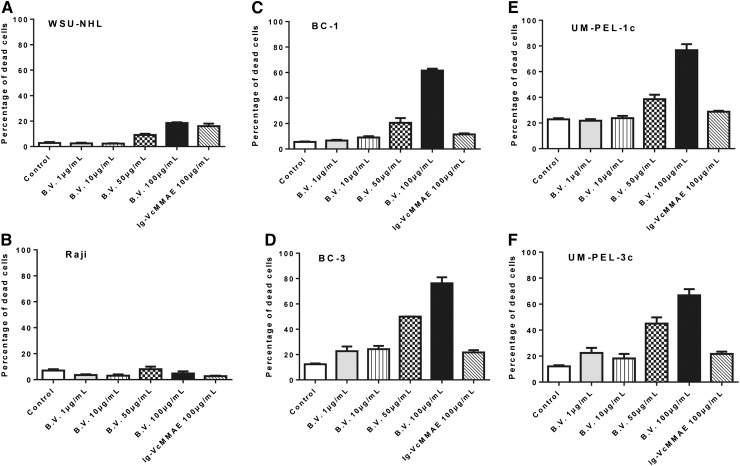
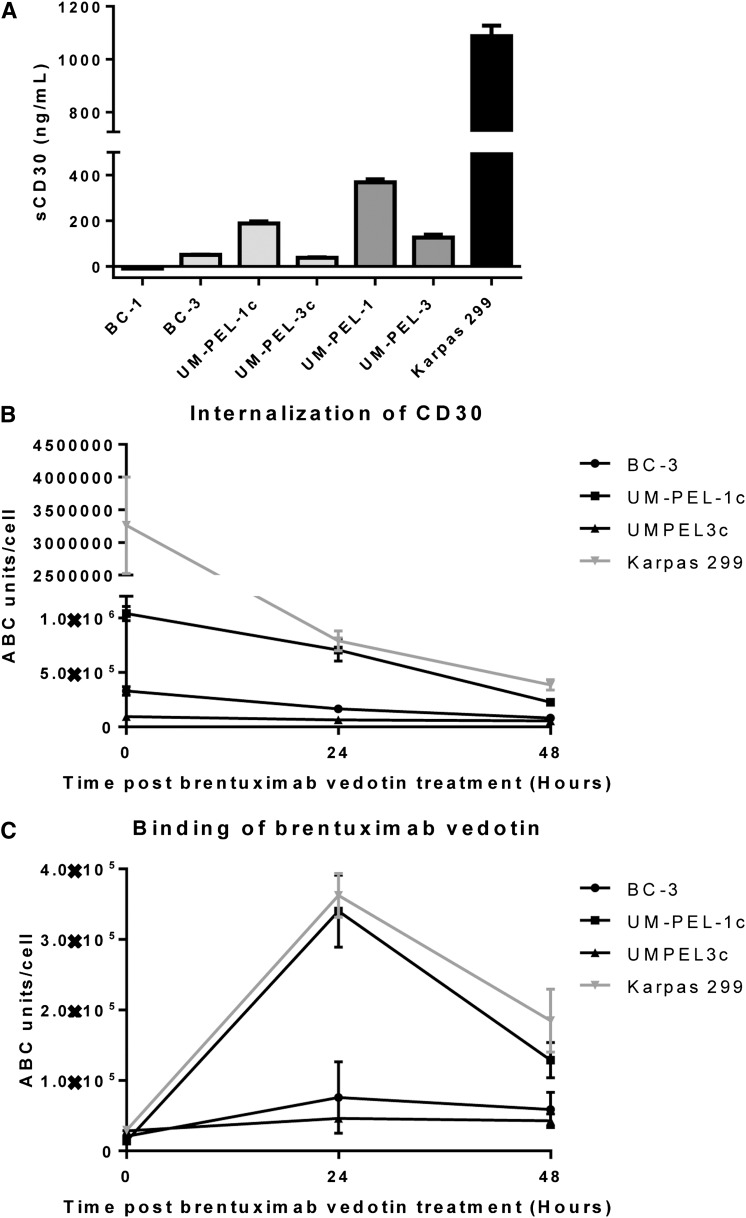
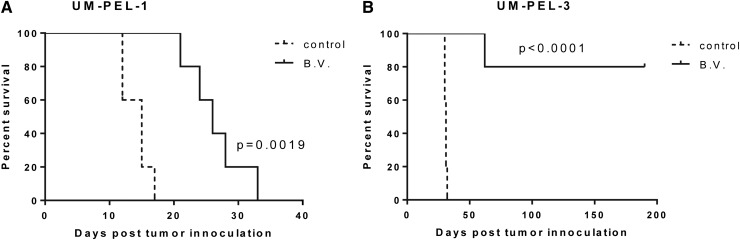
Primary effusion lymphoma (PEL) is an aggressive subtype of non-Hodgkin lymphoma characterized by short survival with current therapies, emphasizing the urgent need to develop new therapeutic approaches. Brentuximab vedotin (SGN-35) is an anti-CD30 monoclonal antibody (cAC10) conjugated by a protease-cleavable linker to a microtubule-disrupting agent, monomethyl auristatin E. Brentuximab vedotin is an effective treatment of relapsed CD30-expressing Classical Hodgkin and systemic anaplastic large cell lymphomas. Herein, we demonstrated that PEL cell lines and primary tumors express CD30 and thus may serve as potential targets for brentuximab vedotin therapy. In vitro treatment with brentuximab vedotin decreased cell proliferation, induced cell cycle arrest, and triggered apoptosis of PEL cell lines. Furthermore, in vivo brentuximab vedotin promoted tumor regression and prolonged survival of mice bearing previously reported UM-PEL-1 tumors as well as UM-PEL-3 tumors derived from a newly established and characterized Kaposi's sarcoma-associated herpesvirus- and Epstein-Barr virus-positive PEL cell line. Overall, our results demonstrate for the first time that brentuximab vedotin may serve as an effective therapy for PEL and provide strong preclinical indications for evaluation of brentuximab vedotin in clinical studies of PEL patients.
Figures
Similar articles
-
Identification of the Ki-1 antigen (CD30) as a novel therapeutic target in systemic mastocytosis.Blood. 2015 Dec 24;126(26):2832-41. doi: 10.1182/blood-2015-03-637728. Epub 2015 Oct 20. Blood. 2015. PMID: 26486787 Free PMC article.
-
Brentuximab vedotin.MAbs. 2012 Jul-Aug;4(4):458-65. doi: 10.4161/mabs.20230. Epub 2012 Jul 1. MAbs. 2012. PMID: 22684302 Free PMC article. Review.
-
Brentuximab vedotin exerts profound antiproliferative and pro-apoptotic efficacy in CD30-positive as well as cocultured CD30-negative germ cell tumour cell lines.J Cell Mol Med. 2018 Jan;22(1):568-575. doi: 10.1111/jcmm.13344. Epub 2017 Sep 22. J Cell Mol Med. 2018. PMID: 28941150 Free PMC article.
-
cAC10-vcMMAE, an anti-CD30-monomethyl auristatin E conjugate with potent and selective antitumor activity.Blood. 2003 Aug 15;102(4):1458-65. doi: 10.1182/blood-2003-01-0039. Epub 2003 Apr 24. Blood. 2003. PMID: 12714494
-
Anti-CD30 antibody-drug conjugate therapy in lymphoma: current knowledge, remaining controversies, and future perspectives.Ann Hematol. 2023 Jan;102(1):13-29. doi: 10.1007/s00277-022-05054-9. Epub 2022 Dec 13. Ann Hematol. 2023. PMID: 36512081 Free PMC article. Review.
Cited by
-
Current status of treatment for primary effusion lymphoma.Intractable Rare Dis Res. 2014 Aug;3(3):65-74. doi: 10.5582/irdr.2014.01010. Intractable Rare Dis Res. 2014. PMID: 25364646 Free PMC article. Review.
-
Sustained complete remission of primary effusion lymphoma with adjunctive ganciclovir treatment in an HIV-positive patient.BMJ Case Rep. 2014 Oct 13;2014:bcr2014204533. doi: 10.1136/bcr-2014-204533. BMJ Case Rep. 2014. PMID: 25312890 Free PMC article.
-
Primary effusion lymphoma: current perspectives.Onco Targets Ther. 2018 Jun 28;11:3747-3754. doi: 10.2147/OTT.S167392. eCollection 2018. Onco Targets Ther. 2018. PMID: 29988764 Free PMC article. Review.
-
Brentuximab vedotin: clinical updates and practical guidance.Blood Res. 2017 Dec;52(4):243-253. doi: 10.5045/br.2017.52.4.243. Epub 2017 Dec 26. Blood Res. 2017. PMID: 29333400 Free PMC article. Review.
-
CD30-targeting drugs: cure for mastocytosis?Blood. 2015 Dec 24;126(26):2771-3. doi: 10.1182/blood-2015-11-678631. Blood. 2015. PMID: 26705339 Free PMC article.
References
-
- Cesarman E, Chang Y, Moore PS, Said JW, Knowles DM. Kaposi’s sarcoma-associated herpesvirus-like DNA sequences in AIDS-related body-cavity-based lymphomas. N Engl J Med. 1995;332(18):1186–1191. - PubMed
-
- Jones D, Ballestas ME, Kaye KM, et al. Primary-effusion lymphoma and Kaposi’s sarcoma in a cardiac-transplant recipient. N Engl J Med. 1998;339(7):444–449. - PubMed
-
- Nador RG, Cesarman E, Chadburn A, et al. Primary effusion lymphoma: a distinct clinicopathologic entity associated with the Kaposi’s sarcoma-associated herpes virus. Blood. 1996;88(2):645–656. - PubMed
-
- Arvanitakis L, Mesri EA, Nador RG, et al. Establishment and characterization of a primary effusion (body cavity-based) lymphoma cell line (BC-3) harboring kaposi’s sarcoma-associated herpesvirus (KSHV/HHV-8) in the absence of Epstein-Barr virus. Blood. 1996;88(7):2648–2654. - PubMed
-
- Chang Y, Cesarman E, Pessin MS, et al. Identification of herpesvirus-like DNA sequences in AIDS-associated Kaposi’s sarcoma. Science. 1994;266(5192):1865–1869. - PubMed
Publication types
MeSH terms
Substances
Grants and funding
LinkOut - more resources
Full Text Sources
Other Literature Sources
