Review
. 2013 Aug 1;5(8):a010132.
doi: 10.1101/cshperspect.a010132.

DNA replication timing

Affiliations
Review

DNA replication timing

Nicholas Rhind et al. Cold Spring Harb Perspect Biol. .

Abstract

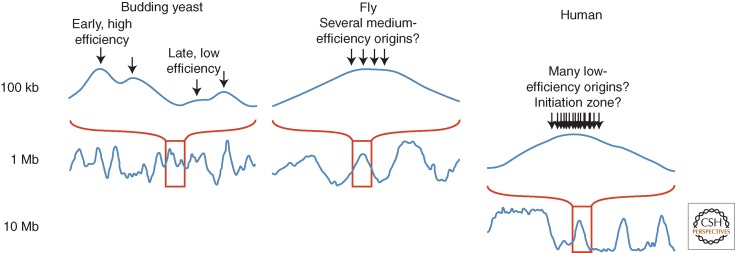
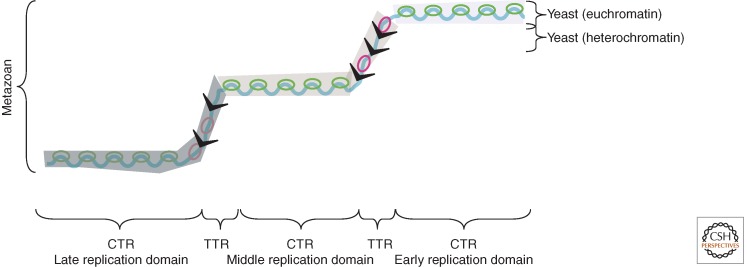
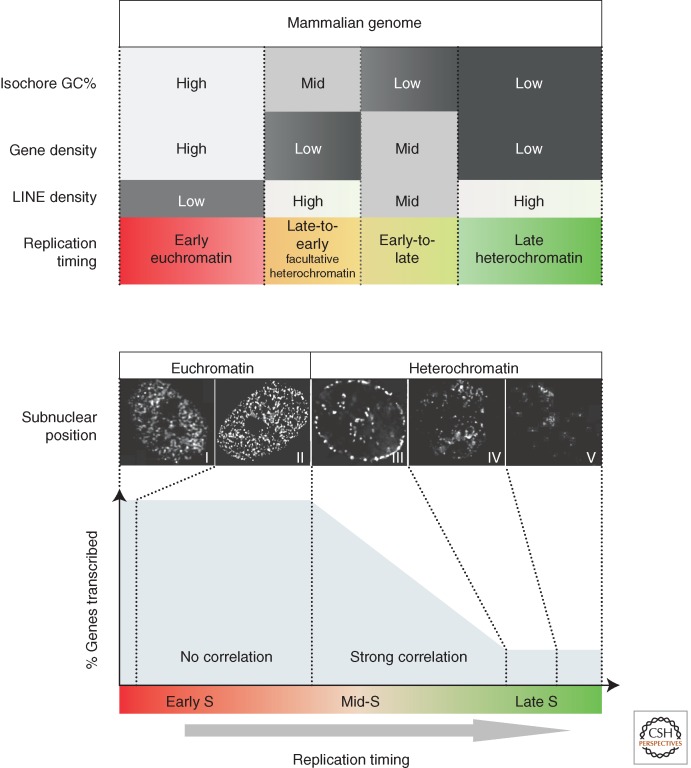
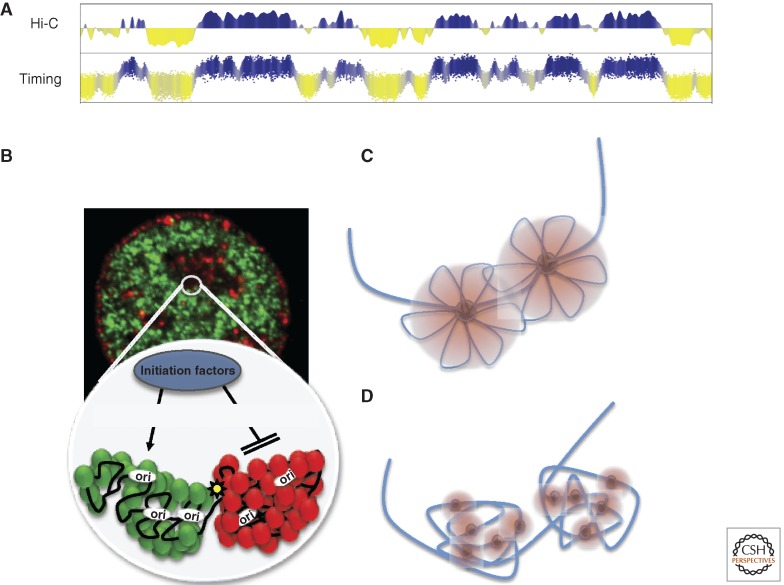
Patterns of replication within eukaryotic genomes correlate with gene expression, chromatin structure, and genome evolution. Recent advances in genome-scale mapping of replication kinetics have allowed these correlations to be explored in many species, cell types, and growth conditions, and these large data sets have allowed quantitative and computational analyses. One striking new correlation to emerge from these analyses is between replication timing and the three-dimensional structure of chromosomes. This correlation, which is significantly stronger than with any single histone modification or chromosome-binding protein, suggests that replication timing is controlled at the level of chromosomal domains. This conclusion dovetails with parallel work on the heterogeneity of origin firing and the competition between origins for limiting activators to suggest a model in which the stochastic probability of individual origin firing is modulated by chromosomal domain structure to produce patterns of replication. Whether these patterns have inherent biological functions or simply reflect higher-order genome structure is an open question.


Figures

Figure 1.
Figure 1.
Scales of replication timing in species with different-sized genomes. Smoothed replication profiles of segments of the human (Ryba et al. 2010), fly (Schwaiger et al. 2009), and budding yeast genomes (Alvino et al. 2007; Yang et al. 2010). Although the profiles look qualitatively similar, they show features on very different scales. In yeasts, the peaks in the replication profiles represent individual origins and the average replication times of origins are determined by a combination of their average firing times and the frequency with which they are passively replicated by forks originating at neighboring origins. In mammals, what appear to be sharp peaks of early replication flatten at higher resolution to broad, near-megabase-sized domains, which contain many unresolved individual replicons. This lack of resolution can be accounted for by spatial or temporal heterogeneity in origin firing within each domain. Fly genomes are an order of magnitude smaller than human, and their domains of coordinate replication are similarly smaller but still probably contain multiple unresolved replicons. The slope of the curves moving away from early-replicating regions is often interpreted as being proportional to the rate of replication in that region. However, even in budding yeasts, where origins can be very efficient, this correlation is not strong; the slope is determined more by the ratio of fork directions than by the rate of those forks (Sekedat et al. 2010; Retkute et al. 2011).
Figure 2.
Figure 2.
Interpreting replication profiles in different species. A hypothetical segment of a replication timing profile contains regions of constant timing (CTRs), or “replication domains,” that replicate at different times during S phase, and regions of temporal transition (TTRs). However, these regions can be interpreted differently depending on genome size and computational parameters. In metazoan genomes, replication domains can be operationally defined regions where replication timing differs by 10%–20% of the length of S phase. The similarity of replication timing within such domains is proposed to be due in part to the heterogeneous, population-averaged firing of adjacent origins (green bubbles) with similar firing times, but in the case of large CTRs can be due to the nearly simultaneous firing of adjacent but independently regulated replication domains. The actual number of initiation sites within each domain that can potentially be used in a population of cells is believed to be in the dozens (origin clusters) to hundreds (initiation zones). TTRs are regions of suppressed origin activity (indicated as a gray “slime”), which may be replicated either by a single fork (black arrows) moving unidirectionally through time (y-axis) or—if slow-moving forks stimulate firing of inefficient or “dormant” origins—by sequentially activated origins (red bubbles). In contrast, the entire genome in less complex organisms such as yeasts can be thought of as a single replication domain, with the majority of regulation controlled by more origin-proximal mechanisms. The exception is the late-replicating heterochromatin, such as telomeres, which form the equivalents of TTRs, being passively replicated by forks originating in neighboring euchromatic regions.
Figure 3.
Figure 3.
Relationship between isochore properties and replication timing regulation, subnuclear positioning, and transcription. (Top) Isochores with unusual sequence properties are subject to replication timing regulation. The mammalian genome is partitioned into isochores with different GC content, LINE composition, and gene density, which are generally correlated. Isochores that are high in GC and gene density but low in LINE density are replicated early in S phase, whereas the alternate extremes are replicated late. Isochores with intermediate or mixed sequence features are frequently subject to replication timing regulation during differentiation (speculatively labeled “Facultative heterochromatin”) (Hiratani et al. 2008; Ryba et al. 2010). (Bottom) Changes in replication timing that traverse the middle of S phase accompany changes in subnuclear position and transcriptional potential. Replication early in S phase (patterns I and II) takes place within the interior euchromatic compartment, whereas replication later in S phase (patterns III, IV, and V) takes place at the nuclear periphery (pattern III), at the nucleolar periphery (pattern III), and at internal blocks of heterochromatin (patterns IV and V) (Berezney et al. 2000; McNairn and Gilbert 2003). Note the dramatic transition from euchromatic to heterochromatic replication pattern during mid-S phase (from pattern II to III). In addition, a strong relationship between earlier replication timing and transcription is observed for genes that replicate during mid- to late stages of S phase (“strong correlation”; corresponds to pattern III) (Hiratani et al. 2008). Very few genes are replicated at the end of S phase. In contrast, genes that are replicated in the first third of S phase have equally high probability of being expressed (“no correlation”), and thus even large changes within this period may not accompany changes in subnuclear repositioning and/or transcriptional competence may be inconsequential for transcription. The figure illustrates how the durations of different spatial replication patterns are likely to relate to the probability of transcription based on published results (Dimitrova and Gilbert 1999; Hiratani et al. 2008). These relationships imply that genome-wide replication timing analyses provide a means to infer changes in subnuclear position and transcriptional potential (Hiratani et al. 2008). Together these observations strongly suggest that changes in replication timing that traverse the mid-S phase (i.e., pattern II to III or vice versa) accompany subnuclear repositioning and altered transcriptional potential, with the latter likely confined to certain classes of genes. We submit that although genome-wide analysis of subnuclear position changes by fluorescence in situ hybridization is impractical, these spatiotemporal patterns of replication provide a proxy of their 3D distribution. Genome-wide replication timing analyses provide a means to infer changes in subnuclear position and even transcriptional potential using these relationships (Hiratani et al. 2008). Photos are deconvolved images from Chinese hamster cells pulse-labeled with bromodeoxyuridine at different times during S phase (J Lu and DM Gilbert, unpubl.). (From Hiratani et al. 2009; adapted, with permission, from Elsevier.)
Figure 4.
Figure 4.
Units of replication timing regulation correspond to units of large-scale chromatin organization. (A) Replication timing profiles align better to eigenvector displays of chromatin conformation capture profiles than to any other structural or functional property of chromosomes examined to date (Ryba et al. 2010). (B) Regions that replicate at different times are spatially segregated and may form self-interacting domains that may set thresholds for the accessibility of S-phase promoting factors. (C,D) Two interpretations of replication foci. (C) Concept of a replication factory where several replicons in a spatially contiguous chromosome region are replicated by a common, fixed replication protein complex. (D) Current super-resolution microscopy methods suggest that replication foci consist of clusters of smaller foci that were not resolved by prior light microscopy. Together the data suggest that foci are the result of several separate replication complexes, possibly replicating both bidirectional leading and lagging strands together (Heun et al. 2001; Kitamura et al. 2006; Meister et al. 2007), but rather than being a single fixed complex, they consist of a spatially clustered group of independent replication complexes that initiate replication nearly synchronously, possibly as a result of their common presence within a single self-interacting unit of large-scale chromatin organization. (A and B from Ryba et al. 2010; reprinted, with permission, © Cold Spring Harbor Laboratory Press.)

References

    1. Agier N, Fischer G 2012. The mutational profile of the yeast genome is shaped by replication. Mol Biol Evol 29: 905–913 - PubMed
    1. Aladjem MI, Rodewald LW, Lin CM, Bowman S, Cimbora DM, Brody LL, Epner EM, Groudine M, Wahl GM 2002. Replication initiation patterns in the β-globin loci of totipotent and differentiated murine cells: Evidence for multiple initiation regions. Mol Cell Biol 22: 442–452 - PMC - PubMed
    1. Alvino GM, Collingwood D, Murphy JM, Delrow J, Brewer BJ, Raghuraman MK 2007. Replication in hydroxyurea: It’s a matter of time. Mol Cell Biol 27: 6396–6406 - PMC - PubMed
    1. Anglana M, Apiou F, Bensimon A, Debatisse M 2003. Dynamics of DNA replication in mammalian somatic cells: Nucleotide pool modulates origin choice and interorigin spacing. Cell 114: 385–394 - PubMed
    1. Aparicio JG, Viggiani CJ, Gibson DG, Aparicio OM 2004. The Rpd3-Sin3 histone deacetylase regulates replication timing and enables intra-S origin control in Saccharomyces cerevisiae. Mol Cell Biol 24: 4769–4780 - PMC - PubMed

Publication types