. 2013 Jul 9;3(7):e280.
doi: 10.1038/tp.2013.54.

CD4⁺ but not CD8⁺ T cells revert the impaired emotional behavior of immunocompromised RAG-1-deficient mice

Affiliations

CD4⁺ but not CD8⁺ T cells revert the impaired emotional behavior of immunocompromised RAG-1-deficient mice

L Rattazzi et al. Transl Psychiatry. .

Abstract

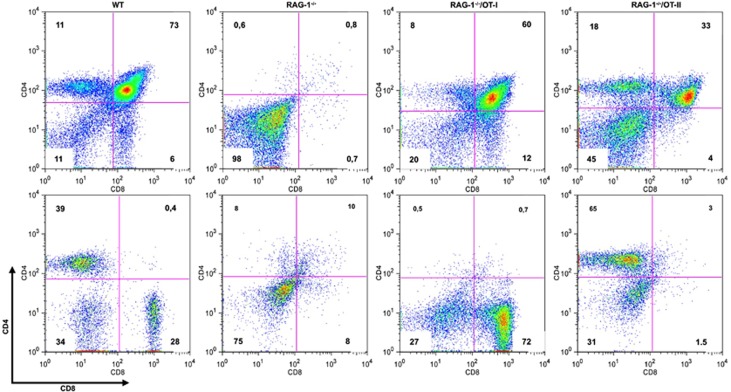
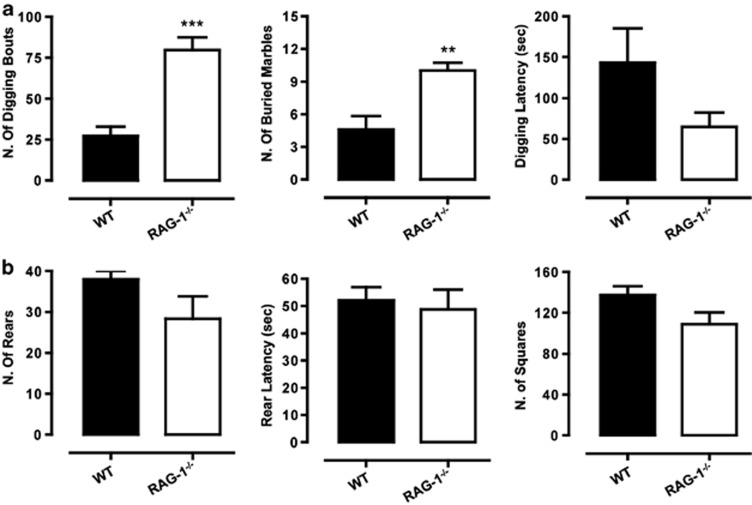
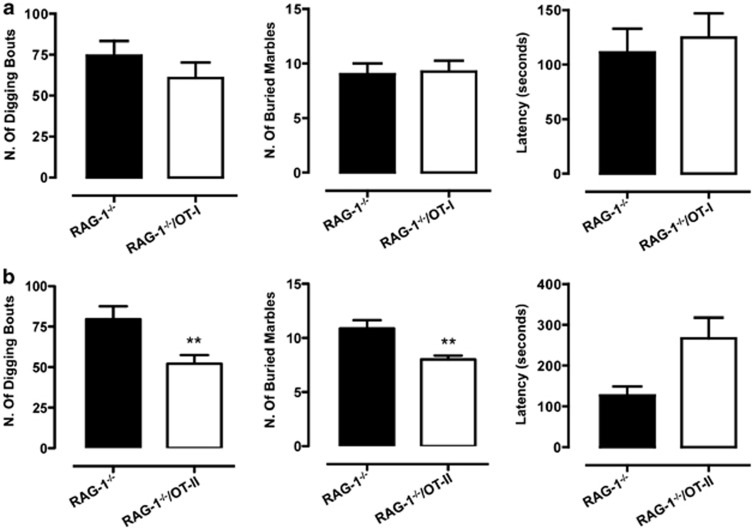
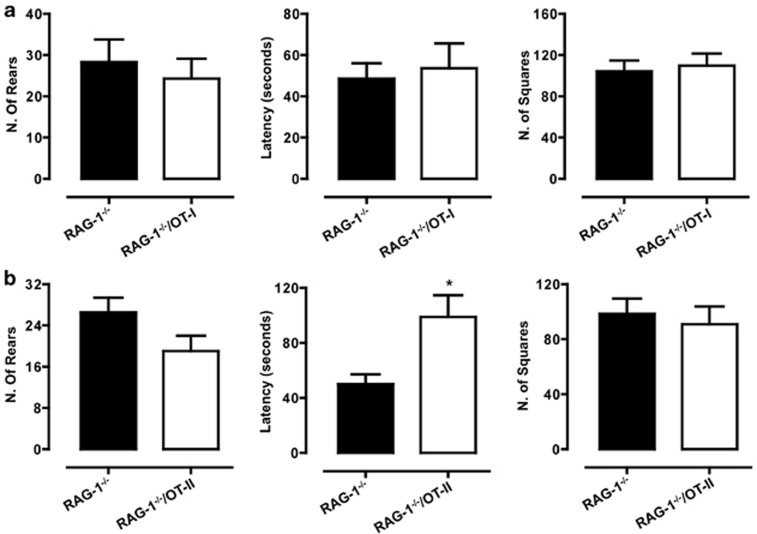
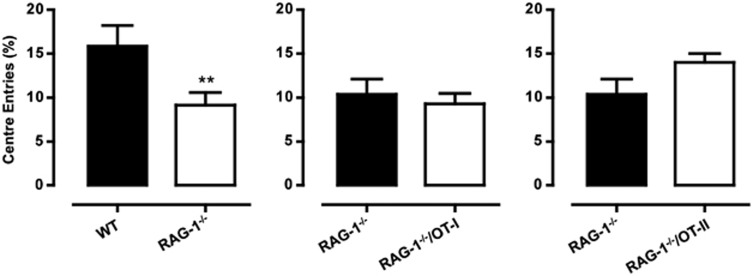
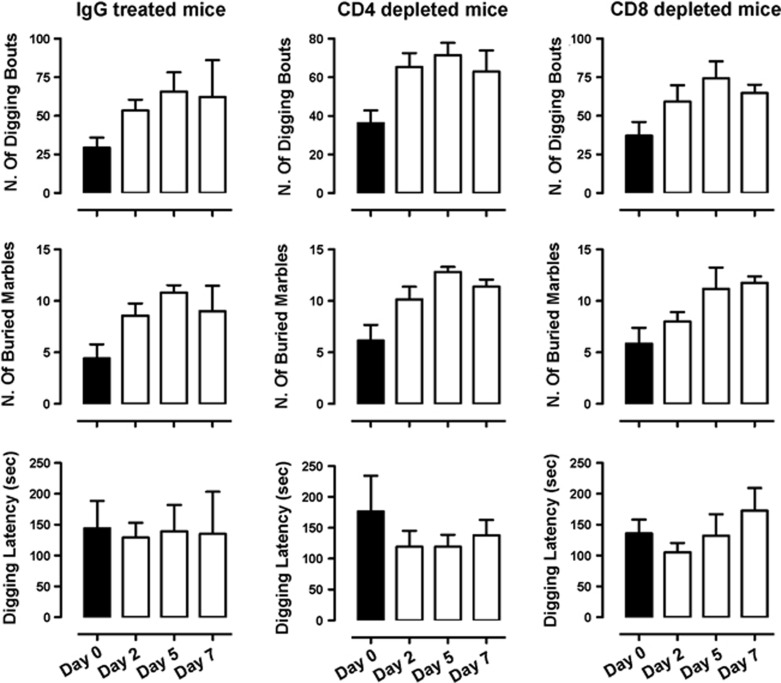
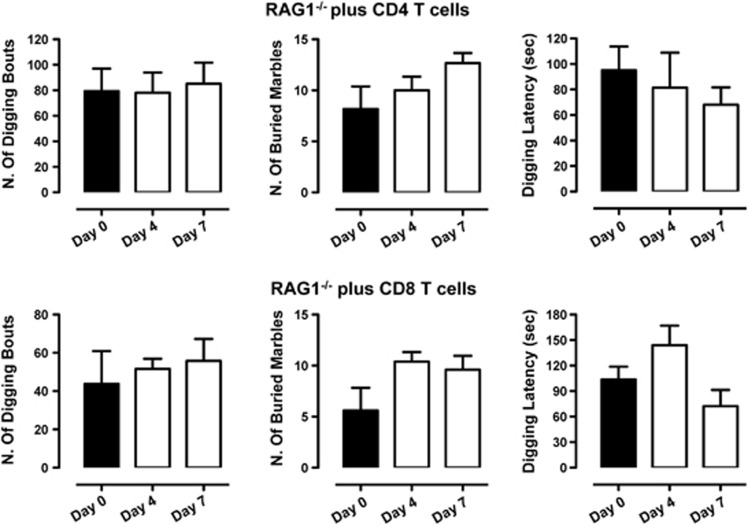
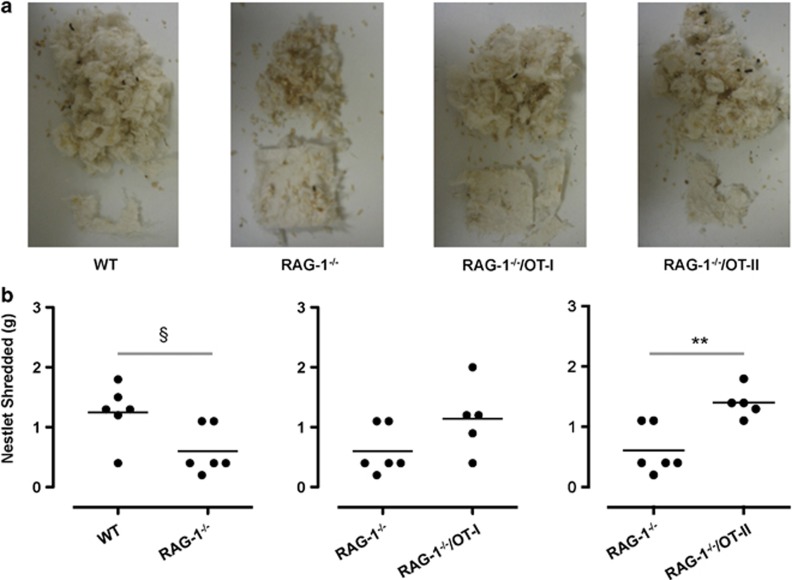
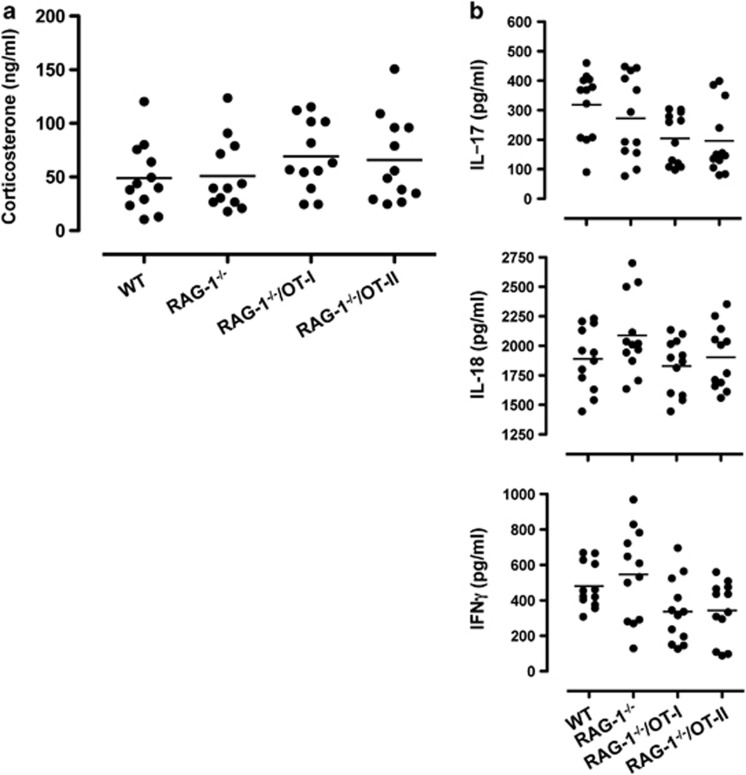
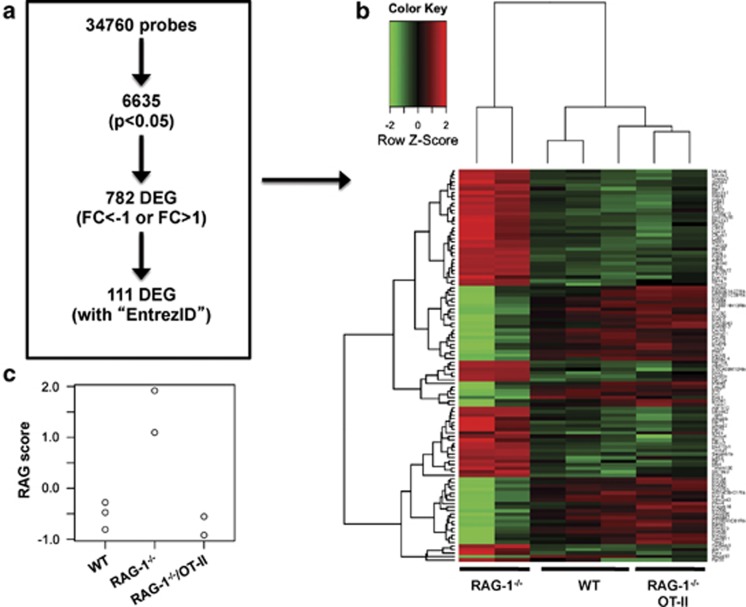
An imbalanced immune system has long been known to influence a variety of mood disorders including anxiety, obsessive-compulsive disorders and depression. In this study, we sought to model the impact of an immunocompromised state on these emotional behaviors using RAG-1⁻/⁻ mice, which lack T and B cells. We also investigated the relative contribution of CD4⁺ or CD8⁺ T cells to these manifestations using RAG-1⁻/⁻/OT-II and RAG-1⁻/⁻/OT-I transgenic mice, respectively. Our results show that RAG-1⁻/⁻ mice present a significant increase in digging and marble-burying activities compared with wild-type mice. Surprisingly, these anxiety-like behaviors were significantly reverted in RAG-1⁻/⁻/OT-II but not RAG-1⁻/⁻/OT-I transgenic mice. Immunodepletion experiments with anti-CD4 or anti-CD8 in C57/BL6 mice or repopulation studies in RAG-1⁻/⁻ mice did not reproduce these findings. Microarray analysis of the brain of RAG-1⁻/⁻ and RAG-1⁻/⁻/OT-II mice revealed a significantly different gene fingerprint, with the latter being more similar to wild-type mice than the former. Further analysis revealed nine main signaling pathways as being significantly modulated in RAG-1⁻/⁻ compared with wild-type mice. Taken together, these results suggest that life-long rather than transient immunodeficient conditions influence the emotional behaviors in mice. Most interestingly, these effects seem to correlate with a specific absence of CD4⁺ rather than CD8⁺ T cells. Validation of these findings in man might provide new clues on the mechanism by which early life immune modulation might impact mood response in adults and provide a further link between immune and emotional well-being.


Figures

Figure 1
Figure 1
Immune repertoire of RAG-1−/−, RAG-1−/−/OT-I and RAG-1−/−/OT-II mice. Thymocytes and lymphocytes from male wild-type (WT), RAG-1−/−, RAG-1−/−/OT-I and RAG-1−/−/OT-II mice were analyzed for CD4 and CD8 expression. The dot plots show the T-cell profiles of RAG-1−/−, RAG-1−/−/OT-I and RAG-1−/−/OT-II mice in the thymus (upper panel) and in the periphery (lower panel) compared with WT C57BL/6 control mice. The percentage of the cells in each quadrant is given.
Figure 2
Figure 2
Increased digging and marble-burying behavior of RAG-1−/− mice (upper panel). The bar graphs in a shows the total number of digging bouts, buried marbles and the latency to dig (expressed in seconds) measured during the 15min marble-burying test. The bar graphs in b show the total number of rears, the latency to rear (expressed in seconds) and the total number of squares crossed assessed during the 5-min open field test. Values are expressed as mean±s.e.m. of six mice and are representative of n=3–4 separate experiments. **P<0.01 and ***P<0.001 indicate significant values compared with wild-type (WT) C57BL/6 control mice (Mann–Whitney U-test).
Figure 3
Figure 3
CD4+ but not CD8+ T cells revert the increased digging and marble-burying behavior of RAG-1−/− mice. The bar graphs show the total number of digging bouts, buried marbles and the latency to dig (expressed in seconds) in RAG-1−/−/OT-I (a) or RAG-1−/−/OT-II (b) compared with RAG-1−/− during the 15-min marble-burying test. Values are expressed as mean±s.e.m. of six mice and are representative of n=3–4 separate experiments. **P<0.01 indicates significant values compared with RAG-1−/− mice (Mann–Whitney U-test).
Figure 4
Figure 4
No differences in the open field activity between RAG-1−/−/OT-I, RAG-1−/−/OT-II and RAG-1−/−. The bar graphs show the total number of rears, the latency to rear (expressed in seconds) and squares crossed in RAG-1−/−/OT-I (a) or RAG-1−/−/OT-II (b) compared with RAG-1−/− during the 5-min open field test. Values are expressed as mean±s.e.m. of six mice and are representative of n=3–4 separate experiments. *P<0.05 indicates significant values compared with RAG-1−/− mice (Mann–Whitney U-test).
Figure 5
Figure 5
CD4+ but not CD8+ T cells might revert the decreased number of center entries showed by RAG-1−/− mice. The bar graphs show the comparison of the entries into the center between RAG-1−/− and wild-type mice (left panel), RAG-1−/− and RAG−/−/OT-I (middle panel) and RAG−/− and RAG−/−/OT-II (right panel) during the 5-min open field test. Values are expressed as mean±s.e.m. of six mice and are representative of n=3–4 separate experiments. **P<0.01 indicates significant values compared with wild-type C57BL/6 control mice (Mann–Whitney U-test).
Figure 6
Figure 6
Depletion of CD4 or CD8 T cells does not induce anxiety-like behavior in C57/BL6 mice. C57/BL6 mice received an intraperitoneal injection of anti-CD4 (250 μg), anti-CD8- (250 μg) depleting antibodies or IgG control, and then tested in the digging and marble-burying test. The bar graphs show the total number of digging bouts, buried marbles and the latency to dig (expressed in seconds) in mice treated as indicated and assessed before the treatment (day 0) or after 2, 5 and 7 days (day 2, day 5 and day 7, respectively). Values are expressed as mean±s.e.m. of 6–8 mice.
Figure 7
Figure 7
Repopulation of RAG1−/− mice with CD4 or CD8 T cells does not affect their anxiety-like behavior. RAG1−/− mice received an intraperitoneal injection of purified CD4 (2 × 10⁶) or CD8 (2 × 10⁶) T cells and then tested in the digging and marble-burying test. The bar graphs show the total number of digging bouts, buried marbles and the latency to dig (expressed in seconds) in mice assessed before the cell transfer (day 0) or after 4 and 7 days (day 4 and day 7, respectively). Values are expressed as mean±s.e.m. of 6–8 mice.
Figure 8
Figure 8
CD4+ but not CD8+ T cells revert the impaired nest construction of RAG-1−/− mice. (a) Representative pictures of the nestlet shredding activity of wild-type (WT), RAG-1−/−, RAG-1−/−/OT-I and RAG-1−/−/OT-II during an overnight test. (b) Quantitative analysis of nestlet shredding activity expressed as grams of nestlet shredded after an overnight test. Values are expressed as mean±s.e.m. of six mice and are representative of n=3–4 separate experiments. §P<0.05 and **P<0.01 indicate significant values compared with WT C57BL/6 control and RAG−/− mice, respectively (Mann–Whitney U-test).
Figure 9
Figure 9
No differences in corticosterone or inflammatory cytokine serum levels between RAG-1−/−, RAG-1–/–/OT-I and RAG-1–/–/OT-II mice. Levels of corticosterone (a) or interleukin (IL)-17, IL-18 and interferon (IFN)-γ (b) in the serum of wild-type (WT), RAG-1−/−, RAG-1−/−/OT-I and RAG-1−/−/OT-II. Values are expressed as ng ml−1 or as pg ml−1 and are cumulative of n=2–3 experiments.
Figure 10
Figure 10
No differences in gross brain structure between RAG-1−/−, RAG-1–/–/OT-I and RAG-1–/–/OT-II mice. The pictures show the coronal hematoxylin and eosin -stained sections of brain from wild-type (a), RAG-1−/− (b), RAG-1−/−/OT-I (c) and RAG-1−/−/OT-II (d). The higher magnification represents the hippocampal area. The figures are representative of n=3–4 mice.
Figure 11
Figure 11
Heatmap and Canonical Correspondence Analysis on Microarray data of brain from wild-type (WT), RAG-1−/− and RAG-1–/–/OT-II mice. (a) Genes were filtered by a moderated t-statistics and fold change (FC). The heatmap analysis used annotated genes only (genes with EntrezID). (b) Hierarchical clustering and heatmap analysis of the filtered genes. RAG-1−/− samples showed a distinct cluster. (c) Similarity analysis for the features of RAG-1−/− in comparison with WT. Note that RAG-1−/−/OT-II mice had low scores and were equivalent to WT mice.

References

    1. Irwin M, Patterson T, Smith TL, Caldwell C, Brown SA, Gillin JC, et al. Reduction of immune function in life stress and depression. Biol Psychiatry. 1990;27:22–30. - PubMed
    1. Ziv Y, Schwartz M. Immune-based regulation of adult neurogenesis: implications for learning and memory. Brain Behav Immun. 2008;22:167–176. - PubMed
    1. Yirmiya R, Goshen I. Immune modulation of learning, memory, neural plasticity and neurogenesis. Brain Behav Immun. 2011;25:181–213. - PubMed
    1. Aktas O, Kieseier B, Hartung HP. Neuroprotection, regeneration and immunomodulation: broadening the therapeutic repertoire in multiple sclerosis. Trends Neurosci. 2010;33:140–152. - PubMed
    1. German DC, Eagar T, Sonsalla PK.Parkinson's disease: a role for the immune system Curr Mol Pharmacol 2011(e-pub ahead of print). - PubMed