. 2013 Aug;24(7-8):276-85.
doi: 10.1007/s00335-013-9462-2. Epub 2013 Jul 10.

Maternal inheritance of the Gnas cluster mutation Ex1A-T affects size, implicating NESP55 in growth

Affiliations

Maternal inheritance of the Gnas cluster mutation Ex1A-T affects size, implicating NESP55 in growth

Sally A Eaton et al. Mamm Genome. 2013 Aug.

Abstract

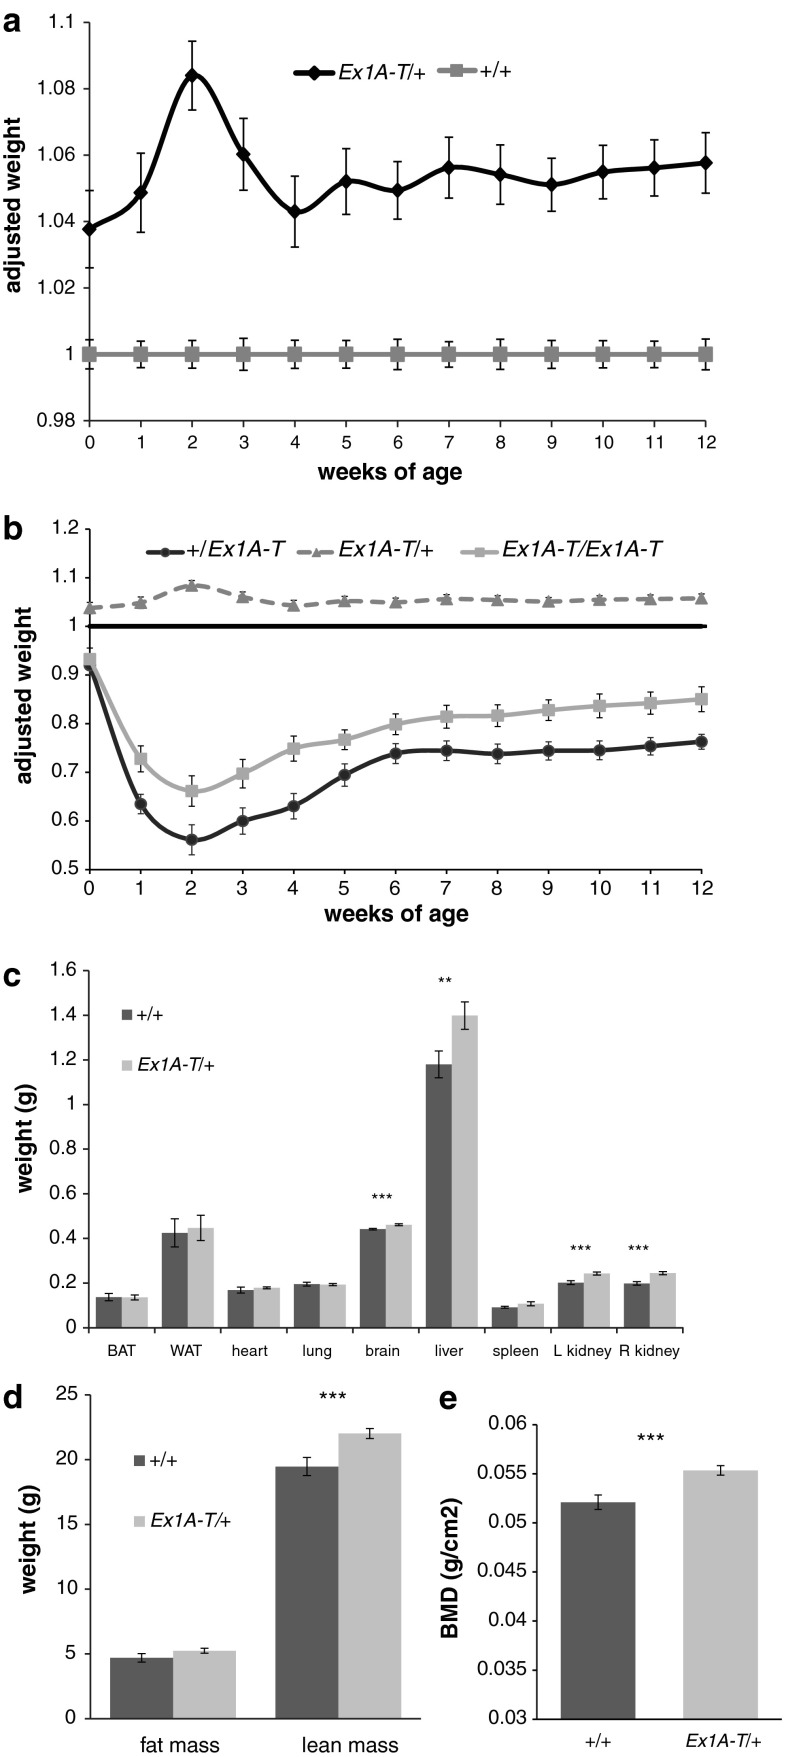
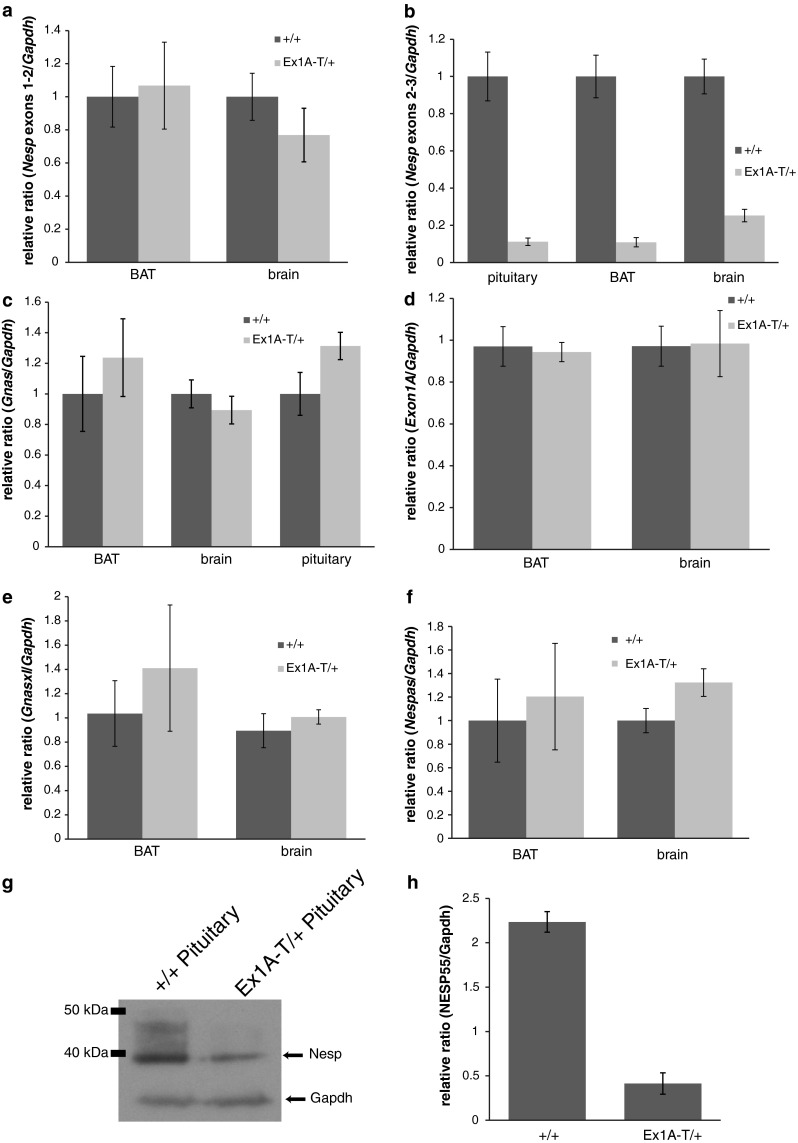
Genes subjected to genomic imprinting are often associated with prenatal and postnatal growth. Furthermore, it has been observed that maternally silenced/paternally expressed genes tend to favour offspring growth, whilst paternally silenced/maternally expressed genes will restrict growth. One imprinted cluster in which this has been shown to hold true is the Gnas cluster; of the three proteins expressed from this cluster, two, Gsα and XLαs, have been found to affect postnatal growth in a number of different mouse models. The remaining protein in this cluster, NESP55, has not yet been shown to be involved in growth. We previously described a new mutation, Ex1A-T, which upon paternal transmission resulted in postnatal growth retardation due to loss of imprinting of Gsα and loss of expression of the paternally expressed XLαs. Here we describe maternal inheritance of Ex1A-T which gives rise to a small but highly significant overgrowth phenotype which we attribute to reduction of maternally expressed NESP55.


Figures

Fig. 1
Fig. 1
Schematic diagram of the mouse Gnas cluster. Maternal (Mat) and paternal (Pat) transcripts are shown above and below the line, respectively. Maternal and paternal differentially methylated regions are shown above and below the line, respectively, and are designated with a “+.” Arrows show initiation and direction of transcription. Coding sections of the transcripts are shown in black whilst noncoding sections are shown in grey. Asterisk denotes that Gnas exon 2 can also be called Nesp exon 3. The transcript corresponding to the paternal Gnas allele is shown as a dotted line to denote that Gnas is paternally repressed in only some tissues. First exons of protein-coding transcripts are shown as filled boxes and first exons of noncoding transcripts are shaded boxes. Figure not to scale [adapted from Plagge et al. (2004) and Williamson et al. (2004)]
Fig. 2
Fig. 2
The Ex1A-T/+ phenotype. a Growth curve of Ex1A-T/+ and their wild-type siblings of both sexes over 12 weeks. Wild-type sibling weights have been normalised to 1 at each time point and weights of the transgenic mice have been taken as a percentage of wild-type weights at each time point. Error bars indicate SEM. For any given time point, n = 90–112. For repeated-measures ANOVA test (0–12 weeks), n = 68, P < 0.001. b Growth curve of Ex1A-T/+, +/Ex1A-T, and Ex1A-T/Ex1A-T mice of both sexes over 12 weeks. Wild-type sibling weights have been normalised to 1 at each time point and weights of the transgenic mice have been taken as a percentage of sibling wild-type weights at each time point. Error bars indicate SEM. For any given time point, n = 14–20 +/Ex1A-T, n = 97–109 Ex1A-T/+, n = 20–23 Ex1A-T/Ex1A-T. For repeated-measure ANOVA test of +/Ex1A-T versus Ex1A-T/Ex1A-T (3–12 weeks), n = 12–19, P < 0.05. For repeated-measure ANOVA test of Ex1A-T/Ex1A-T versus Ex1A-T/+ (0–12 weeks), n = 16–68, P < 0.001. +/Ex1A-T curve taken from Eaton et al. (2012). c Organ weights of 12-week-old male mice. Error bars indicate SEM, n = 6–7, **P < 0.05, ***P < 0.01. d Total fat and lean mass of 12-week-old male mice as analysed by DEXA. Error bars indicate SEM, n = 6–7, ***P < 0.01. e Bone mineral density of 12-week-old male mice as analysed by DEXA. Error bars indicate SEM, n = 6–7, P = 0.010
Fig. 3
Fig. 3
Transcript analysis of Ex1A-T/+ mice. a TaqMan qPCR analysis of upstream Nesp transcript in newborn tissues. This probe is specific for Nesp exon 1–2, upstream of the polyA cassette. Expression was normalised to Gapdh. Error bars indicate SEM, n = 7–9, P = 0.68 for BAT, 0.11 for brain. b SYBR qPCR analysis of truncated Nesp transcript in newborn tissues. Primers were designed at the end of Nesp exon 2 and at the start of Nesp exon 3 (Gnas exon 2) to analyse transcript downstream of the truncation. Expression was normalised to Gapdh, error bars indicate SEM, n = 6–9, P ≤ 0.0012. c TaqMan qPCR analysis of Gnas transcript in newborn tissues. Expression was normalised to Gapdh, error bars indicate SEM, n = 7–9 for BAT and brain, n = 5 for pituitary; P = 0.47 for BAT, 0.61 for brain, 0.076 for pituitary. d SYBR qPCR analysis of Exon1A transcript in newborn tissues. Primers were designed at the end of the Exon1A exon and at the start of Exon1A exon 2 (Gnas exon 2). Expression was normalised to Gapdh, error bars indicate SEM, n = 7–9, P = 0.61 for BAT, 0.68 for brain. e SYBR qPCR analysis of Gnasxl transcript in newborn tissues. Primers were designed at the end of the Gnasxl exon and at the start of Gnasxl exon 2 (Gnas exon 2). Expression was normalised to Gapdh, error bars indicate SEM, n = 7–9, P = 0.76 for BAT, 0.76 for brain. f SYBR qPCR analysis of Nespas transcript in newborn tissues. Primers were designed at the end of the Nespas exon 1 and at the start of Nespas exon 2. Expression was normalised to Gapdh, error bars indicate SEM, n = 2–4, P = 0.8 for BAT, 0.27 for brain. g Western blot of NESP55 and Gapdh loading control in newborn pituitary; 13–14 pituitaries were pooled for each genotype and the blot is representative of at least two replicates. h Signal quantification of NESP55 Western blots, represented in (g). Expression was normalised to Gapdh, error bars indicate SEM, n = 2, P = 0.0083 (assuming a normal distribution)

References

    1. Bartolomucci A, Possenti R, Mahata SK, Fischer-Colbrie R, Loh YP, Salton SR. The extended granin family: structure, function, and biomedical implications. Endocr Rev. 2011;32:755–797. doi: 10.1210/er.2010-0027. - DOI - PMC - PubMed
    1. Bauer R, Ischia R, Marksteiner J, Kapeller I, Fischer-Colbrie R. Localization of neuroendocrine secretory protein 55 messenger RNA in the rat brain. Neuroscience. 1999;91:685–694. doi: 10.1016/S0306-4522(98)00668-X. - DOI - PubMed
    1. Cattanach BM, Peters J, Ball S, Rasberry C. Two imprinted gene mutations: three phenotypes. Hum Mol Genet. 2000;9:2263–2273. doi: 10.1093/oxfordjournals.hmg.a018917. - DOI - PubMed
    1. Charalambous M, da Rocha ST, Ferguson-Smith AC. Genomic imprinting, growth control and the allocation of nutritional resources: consequences for postnatal life. Curr Opin Endocrinol Diabetes Obes. 2007;14:3–12. doi: 10.1097/MED.0b013e328013daa2. - DOI - PubMed
    1. Chen M, Gavrilova O, Liu J, Xie T, Deng C, Nguyen AT, Nackers LM, Lorenzo J, Shen L, Weinstein LS. Alternative Gnas gene products have opposite effects on glucose and lipid metabolism. Proc Natl Acad Sci USA. 2005;102:7386–7391. doi: 10.1073/pnas.0408268102. - DOI - PMC - PubMed

Substances

LinkOut - more resources