. 2013 Oct;57(8):1081-93.
doi: 10.1093/cid/cit452. Epub 2013 Jul 9.

Epidemiology of pyrazinamide-resistant tuberculosis in the United States, 1999-2009

Affiliations

Epidemiology of pyrazinamide-resistant tuberculosis in the United States, 1999-2009

Ekaterina V Kurbatova et al. Clin Infect Dis. 2013 Oct.

Abstract

Background: Pyrazinamide (PZA) is essential in tuberculosis treatment. We describe the prevalence, trends, and predictors of PZA resistance in Mycobacterium tuberculosis complex (MTBC) in the United States.

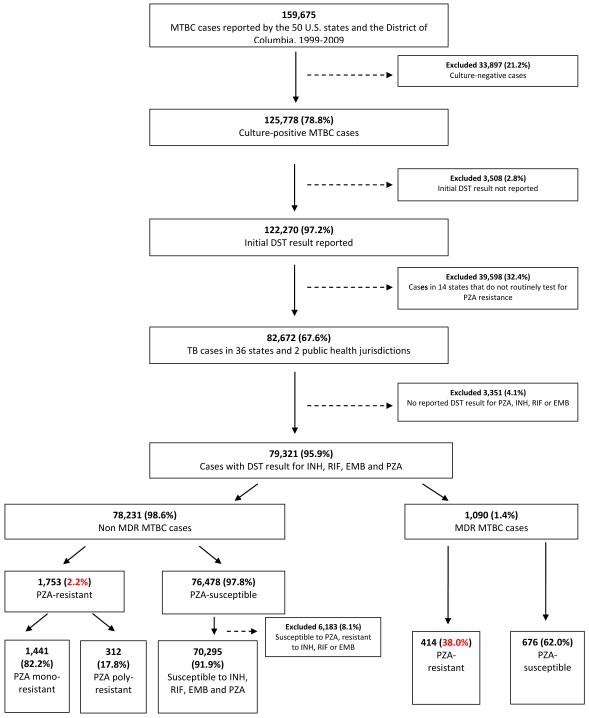
Methods: We analyzed culture-positive MTBC cases with reported drug susceptibility tests for PZA in 38 jurisdictions routinely testing for PZA susceptibility from 1999 to 2009. National Tuberculosis Genotyping Service data for 2004-2009 were used to distinguish M. tuberculosis from Mycobacterium bovis and determine phylogenetic lineage.

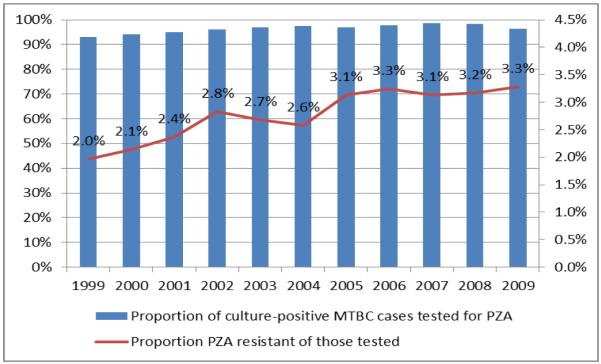
Results: Overall 2.7% (2167/79 321) of MTBC cases had PZA resistance, increasing annually from 2.0% to 3.3% during 1999-2009 (P < .001), largely because of an increase in PZA monoresistance. PZA-monoresistant MTBC (vs drug-susceptible) was associated with an age of 0-24 years (adjusted prevalence ratio [aPR],1.50; 95% confidence interval [CI], 1.31-1.71), Hispanic ethnicity (aPR, 3.52; 95% CI, 2.96-4.18), human immunodeficiency virus infection (aPR, 1.43; 95% CI, 1.15-1.77), extrapulmonary disease (aPR, 3.02; 95% CI, 2.60-3.52), and normal chest radiograph (aPR, 1.88; 95% CI, 1.63-2.16) and was inversely associated with Asian (aPR, 0.59; 95% CI, .47-.73) and black (aPR, 0.37; 95% CI, .29-.49) race. Among multidrug-resistant (MDR) cases, 38.0% were PZA-resistant; PZA resistance in MDR MTBC was associated with female sex (aPR, 1.25; 95% CI, 1.08-1.46) and previous tuberculosis diagnosis (aPR, 1.37; 95% CI, 1.16-1.62). Of 28 080 cases with genotyping data, 925 (3.3%) had PZA resistance; 465 of 925 (50.3%) were M. bovis. In non-MDR M. tuberculosis cases, PZA resistance was higher in the Indo-Oceanic than the East Asian lineage (2.2% vs 0.9%, respectively; aPR, 2.26; 95% CI, 1.53-3.36), but in MDR cases it was lower in the Indo-Oceanic lineage (22.0% vs 43.4%, respectively; aPR, 0.54; 95% CI, .32-.90).

Conclusions: Specific human and mycobacterial characteristics were associated with PZA-resistant MTBC, reflecting both specific subgroups of the population and phylogenetic lineages of the mycobacteria.

Keywords: drug resistance; epidemiology; pyrazinamide; tuberculosis.


Figures

Figure 1
Figure 1
Selection of MTBC cases with resistance to pyrazinamide (PZA) reported in NTSS, 1999-2009
Figure 2
Figure 2
Proportion of culture-positive MTBC cases with a reported PZA drug susceptibility test result, and proportion reported as resistant to PZA among those tested, 1999-2009 (N=122,270) A. Data for 36 states and 2 public health jurisdictions with ≥85% TB cases with reported DST result for PZA (N=82,672) Note. Overall 2.7% of cases had resistance to PZA. Proportions of resistance to PZA significantly increased (APC=5.0, CL: 3.2, 6.7; P<0.001). B. Data for 14 states with <85% TB cases with reported DST result for PZA (N=39,598) Note. Overall 2.9% of cases had resistance to PZA. Proportions of resistance to PZA significantly increased (APC=5.4, CL: 1.2, 9.6; P=0.02).
Figure 2
Figure 2
Proportion of culture-positive MTBC cases with a reported PZA drug susceptibility test result, and proportion reported as resistant to PZA among those tested, 1999-2009 (N=122,270) A. Data for 36 states and 2 public health jurisdictions with ≥85% TB cases with reported DST result for PZA (N=82,672) Note. Overall 2.7% of cases had resistance to PZA. Proportions of resistance to PZA significantly increased (APC=5.0, CL: 3.2, 6.7; P<0.001). B. Data for 14 states with <85% TB cases with reported DST result for PZA (N=39,598) Note. Overall 2.9% of cases had resistance to PZA. Proportions of resistance to PZA significantly increased (APC=5.4, CL: 1.2, 9.6; P=0.02).
Figure 3
Figure 3
Trends in proportions of PZA resistance in MTBC and M. tuberculosis. Percent reflects proportion of cases with specific resistance pattern among all cases tested for PZA drug susceptibility in each sub-set. A. All MTBC cases, with or without available genotype, 1999-2009 (N=79,321) Increase in proportions of PZA-monoresistance was significant (APC during 1999-2002: 12.9, CL: 5.0, 19.7, P=0.005; APC during 2002-2009: 6.0, CL: 4.3, 7.6; P<0.001), while no significant change in proportions of PZA-polyresistance (APC=2.4, CL: −3.6, 8.7; P=0.40) and PZA resistance in MDR (APC=−0.04, CL: −4.2, 4.3; P=0.98) observed. B. MTBC cases with available genotype M. bovis included, 2004-2009 (N=28,080) For monoresistance APC=9.0, CL: 2.5, 15.9; P=0.02; for polyresistance APC=0.3, CL: −37.7, 61.5; P=0.99; for PZA resistance in MDR TB cases APC=−4.4, CL: −19.7, 13.8; P=0.51; for any PZA resistance APC=5.0, CL: −4.5, 15.3; P=0.23 C. M. tuberculosis cases only, 2004-2009 (N=27,428) For monoresistance APC=11.0, CL: 2.6, 20.1; P=0.02; for polyresistance APC=−7.2, CL: −31.4, 25.6; P=0.53; for PZA resistance in MDR TB cases APC=−8.5, CL: −23.2, 8.8; P=0.23; for any PZA resistance APC=−0.1, CL: −8.4, 9.0; P=0.97.
Figure 3
Figure 3
Trends in proportions of PZA resistance in MTBC and M. tuberculosis. Percent reflects proportion of cases with specific resistance pattern among all cases tested for PZA drug susceptibility in each sub-set. A. All MTBC cases, with or without available genotype, 1999-2009 (N=79,321) Increase in proportions of PZA-monoresistance was significant (APC during 1999-2002: 12.9, CL: 5.0, 19.7, P=0.005; APC during 2002-2009: 6.0, CL: 4.3, 7.6; P<0.001), while no significant change in proportions of PZA-polyresistance (APC=2.4, CL: −3.6, 8.7; P=0.40) and PZA resistance in MDR (APC=−0.04, CL: −4.2, 4.3; P=0.98) observed. B. MTBC cases with available genotype M. bovis included, 2004-2009 (N=28,080) For monoresistance APC=9.0, CL: 2.5, 15.9; P=0.02; for polyresistance APC=0.3, CL: −37.7, 61.5; P=0.99; for PZA resistance in MDR TB cases APC=−4.4, CL: −19.7, 13.8; P=0.51; for any PZA resistance APC=5.0, CL: −4.5, 15.3; P=0.23 C. M. tuberculosis cases only, 2004-2009 (N=27,428) For monoresistance APC=11.0, CL: 2.6, 20.1; P=0.02; for polyresistance APC=−7.2, CL: −31.4, 25.6; P=0.53; for PZA resistance in MDR TB cases APC=−8.5, CL: −23.2, 8.8; P=0.23; for any PZA resistance APC=−0.1, CL: −8.4, 9.0; P=0.97.

Comment in

References

    1. Francis J. Curry National Tuberculosis Center and California Department of Public Health. Drug-Resistant Tuberculosis: A Survival Guide for Clinicians. (2nd) 2008
    1. World Health Organization . Guidelines for the programmatic management of drug-resistant tuberculosis. Geneva, Switzerland: 2011. 2011 update. - PubMed
    1. The U.S. Centers for Disease Control and Prevention Treatment of tuberculosis. Morbidity and mortality weekly report Recommendations and reports. 2003;52(RR-11):1–77. - PubMed
    1. Zhang Y, Mitchison D. The curious characteristics of pyrazinamide: a review. The international journal of tuberculosis and lung disease. 2003;7(1):6–21. - PubMed
    1. Mitchison DA. Role of individual drugs in the chemotherapy of tuberculosis. The international journal of tuberculosis and lung disease. 2000;4(9):796–806. - PubMed

MeSH terms