Review
. 2013 Dec;99(12):923-54.
doi: 10.1002/bip.22347.

Fifty years of DNA "breathing": Reflections on old and new approaches

Affiliations
Review

Fifty years of DNA "breathing": Reflections on old and new approaches

Peter H von Hippel et al. Biopolymers. 2013 Dec.

Abstract

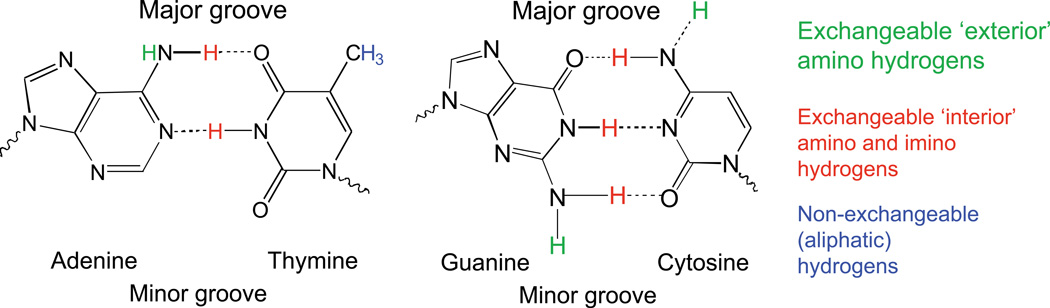
The coding sequences for genes, and much other regulatory information involved in genome expression, are located 'inside' the DNA duplex. Thus the "macromolecular machines" that read-out this information from the base sequence of the DNA must somehow access the DNA "interior." Double-stranded (ds) DNA is a highly structured and cooperatively stabilized system at physiological temperatures, but is also only marginally stable and undergoes a cooperative "melting phase transition" at temperatures not far above physiological. Furthermore, due to its length and heterogeneous sequence, with AT-rich segments being less stable than GC-rich segments, the DNA genome 'melts' in a multistate fashion. Therefore the DNA genome must also manifest thermally driven structural ("breathing") fluctuations at physiological temperatures that should reflect the heterogeneity of the dsDNA stability near the melting temperature. Thus many of the breathing fluctuations of dsDNA are likely also to be sequence dependent, and could well contain information that should be "readable" and useable by regulatory proteins and protein complexes in site-specific binding reactions involving dsDNA "opening." Our laboratory has been involved in studying the breathing fluctuations of duplex DNA for about 50 years. In this "Reflections" article we present a relatively chronological overview of these studies, starting with the use of simple chemical probes (such as hydrogen exchange, formaldehyde, and simple DNA "melting" proteins) to examine the local stability of the dsDNA structure, and culminating in sophisticated spectroscopic approaches that can be used to monitor the breathing-dependent interactions of regulatory complexes with their duplex DNA targets in "real time."

Keywords: DNA base analogue spectroscopy; DNA replication; formaldehyde probing; hydrogen exchange; protein-nucleic acid interactions; single molecule DNA-protein interactions studies; two-dimensional fluorescence spectroscopy.


Figures

Figure 1
Figure 1. Structures of the Watson-Crick base pairs showing the hydrogen moieties that can and cannot undergo exchange
Figure 2
Figure 2
(A) Hydrogen-tritium exchange of native calf thymus DNA at 3.5 ±0.5° in 0.1 M NaCl; 0.014 M (CH3)2 AsOONa (cacodylate), pH 7.6 ± 0.15. (○) DNA, sonicated; (□) DNA, sonicated and EDTA dialyzed; (▽) DNA, unsonicated; (△) DNA (prepared in this laboratory), sonicated . (B) Hydrogen exchange-out curves for native DNAs of different base composition at 0 °C (±0.5 °C) in 0.1 M NaCl, 0.01 M sodium cacodylate, pH 7.6. (○), M. lysodeikticus DNA 72 mole % G+C; (□), calf thymus DNA, 42 mole % G+C; (△) Cl. perfringens DNA, 31 mole % G+C .
Figure 3
Figure 3
(a) Extent of exchange (H/nt) curves at various exchange-out times plotted as a function of pH. 0.11 M Na+ after 180, 540, and 1980 sec of exchange ; (b) 0.51 and 0.20 M Na+ after 300 sec of exchange . (c) The observed ratio of tritium-hydrogen exchange (plotted on a logarithmic ordinate) versus the logarithm of the expected proton transfer rate <k> calculated as in ref . Error limits include variation of half-time estimation from tangents as well as experimental error.
Figure 4
Figure 4. Hydrogens per nucleotide pair remaining after 400 sec exchange as a function of ΔTm (the temperature below the midpoint of the melting curve) in various concentrations of destabilizing salts
(see ref. ) (▼) E. coli DNA; (○) calf thymus DNA; (●) M. lysodeikticus DNA; (■) Cl. perfringens DNA.
Figure 5
Figure 5. Various possible transient local distortions of the native DNA structure
(a) Native structure, stacked, hydrogen bonded and helical. (b) Chains untwisted, bases hydrogen bonded but unstacked. (c) Chains untwisted, bases stacked but not hydrogen bonded. (d) Structure "melted", bases unstacked and not hydrogen bonded. (d) Structure "melted", bases unstacked and not yet hydrogen bonded, partial chain separation. (e) Structure totally "melted", chains separated. From ref. .
Figure 6
Figure 6
(A) (left panels) (a) Spectrum of 5'-dAMP: (⊙) control; (△) with 1.05 M formaldehyde. (b) Difference spectra of 5'-dAMP in the presence of added formaldehyde: (⊙) 0.05 M; (▽) 0.21 M; (△) 1.05 M. (right panels) (a) Spectrum of 5'-dCMP: (⊙) control; (△) with 1.07 M formaldehyde. (b) Difference spectra of 5'-dCMP in the presence of added formaldehyde: (⊙) 0.05 M; (▽) 0.21 M; (△) 1.07 M. (B) (a) Equilibrium absorbance changes (274 nm) of 5'-dAMP with added formaldehyde plotted according to ref (b) Equilibrium absorbance changes (288 nm) of 5'-dCMP with added formaldehyde,. (C) Plot of pseudo-first-order rate constant, k', vs. formaldehyde concentration: (⊙) 5'-dCMP; (●) 5'-dGMP; (△) 5'-dAMP. Figures from ref. .
Figure 7
Figure 7
(a) Kinetics of denaturation of calf thymus DNA by 1.06 M HCHO at various temperatures from 53 to 66 °C, as marked. Reaction observed at A252 and normalized to overall absorbance change; as described in ref. this wavelength measures (for calf thymus DNA) an average degree of helix denaturation independent of the chemical reaction. Buffer was 0.02 M phosphate pH 6.96. (b) Initial phase of denaturation of T7 DNA by 1.0 HCHO at temperatures ranging from 38 to 53 °C. Reactions observed at 254 nm and expressed as change in absorbance per mole of DNA nucleotide. Lines are least-square best-fit quadratics, as described in ref. (0.002 M phosphate, pH 7.1).
Figure 8
Figure 8
Calculated relation between DNA Tm and formaldehyde concentration, for DNAs of base composition ranging from 0-100% AT as marked on each curve. Calculations are described in and correspond to a solvent of approximately 0.01 M Na+.
Figure 9
Figure 9. Histogram of 26 molecules of λ DNA partially denatured by 1 M HCHO at 58 °C, in 0.02 M phosphate, pH 6.95
Figure 10
Figure 10. Melting activity of an excess of single-stranded DNA binding protein on dsDNAs of varying sequence
(a) "Natural" dsDNA sequences are kinetically blocked from binding single-stranded binding protein (here T4-coded gp32 with a binding site size [n] of 7 nt), even when free ssDNA ends (above) or internal (dA-dT-rich) internal loops (below) are precoated with the protein to nucleate the melting process under protein concentrations and temperature conditions at which melting process is thermodynamically favored (b) In contrast, dsDNA consisting of alternating dA-dT sequences does melt to equilibrium under these conditions, presumably because this DNA can form transiently palindromic looped-out structures that expose ssDNA binding sites that are long enough to be trapped by gp32 at temperatures close to Tm (see ).
Figure 11
Figure 11. Spontaneous Melting of dsNA Segments Can Occur in the Presence of Melting Proteins if Thermally Unpaired Nucleotide Residues Can Be Trapped Sequentially
(a) Equilibrium unpairing at a primer-template (P-T) DNA junction in the presence of excess DNA melting protein (here a hypothetical single-stranded DNA binding protein with n = 5 nt). (b) This opening and binding reaction is kinetically blocked (ΔG° ≈ 8kT) if the entire 5 bp segment must open simultaneously. (c) In contrast, the reaction can proceed to equilibrium if single bp opening events (ΔG° ≈ 1.5kT) at the P-T junction can be trapped sequentially. For simplicity of representation the binding of the protein to each newly opened bp is represented here as thermodynamically “neutral” (i.e., the unfavorable free energy of opening is exactly offset by the favorable free energy of sequential [partial] binding of the newly exposed ssDNA nt by the “flexible” ssDNA binding protein). (ref. )
Figure 12
Figure 12. A dimeric motor protein moving along its “track” without slippage
(a) This schematic represents the “single-step” advance (and ATP binding and hydrolysis) steps in the walking of a dimeric (two-footed) kinesin molecule along a tubulin track. (b) The free energy of the different reaction states and a postulated energy of activation profile for the binding of the leading foot reaction state in which both feet of the kinesin motor are bound is thermodynamically more stable than the singly bound state, indicating that the release of the lagging foot is likely to be the energy- requiring step in the overall single-step advance reaction. (ref. )
Figure 13
Figure 13. A model of the dsDNA unwinding process catalyzed by a hexameric helicase using a sequential single base pair opening and trapping process
(a) Here the unpairing reaction is driven by thermal fluctuations and the hexameric helicase uses the ssDNA binding site of its leading subunit (shaded gray) to capture and accumulate a single unpaired nt. Once a full binding site size of DNA has been accumulated (here in a tightly coupled helicase step devoid of slippage), the lagging helicase subunit (blue sphere) is released and relocated to participate in the next single-step helicase reaction cycle. The lagging helicase domain release and reorientation phase is driven by ATP hydrolysis. (b) Activation free energy diagram for the above single-step process. Note that the entire reaction coordinate shown corresponds to the forward movement into the dsDNA of only one helicase-binding domain.
Figure 14
Figure 14. Structures of the base analogues 6-MI-C, PC-G, 2-AP-T and canonical base pairs. Modifications are in red
Figure 15
Figure 15. Spectroscopic properties of DNA containing different base analog dimer probes
(a) Quenching of dimer probes in dsDNA relative to ssDNA. CD spectra of 6-MI dimer probes (b) below 300 nm and (c) above 300 nm.
Figure 16
Figure 16. Spectroscopic properties of forked DNA constructs as a function of position relative to the ssDNA–dsDNA junction
(a) Fluorescence intensity changes at 370 nm for constructs containing single 2-AP probes. (b) CD spectra for constructs containing 2-AP dimer probes at the indicated positions. Spectra labeled upC correspond to dsDNA control constructs containing no 2-AP probes (ref. ).
Figure 17
Figure 17. Proposed unwinding mechanism of the T4 primosome helicase
The constituents of the primosome are gp41 subunits (blue ellipses), gp61 subunit (red ellipses), GTP (yellow rectangles), and GDP (red rectangles). The “degree of openness” of the base pairs adjacent to the ss–dsDNA junction is indicated in each panel, and the numbers below each DNA construct represent the numbering of the various base pairs prior to initial helicase binding. Step a: The GTP-bound gp41 hexameric helicase loads onto the free DNA fork construct and the gp61 primase subunit binds and stabilizes the complex at the fork junction. Positioning is facilitated by the uniquely unstacked conformation of the −1 bases. As a result of this initial binding the first duplex (breathing) base pair at position 1 is fully unwound and the breathing of the base pairs at initial positions 2, 3, and 4 are all enhanced. Step b: GTP hydrolysis occurs at the gp41–gp41 interface positioned adjacent to the bound gp61 subunit, destabilizing that subunit interface and permitting the primosome to “capture” the now unwound first base pair of the original duplex. This base pair becomes the new −1 position, thereby moving the breathing properties of each base pair at the fork one position further into the duplex sequence. The gp41 hexamer rotates by one subunit (approximately 60°) and the primase translocates to the next gp41–gp41 interface. Step c: The GDP (and Pi) hydrolysis products formed in step B dissociate, a new GTP binds and stabilizes the previously destabilized gp41–gp41 subunit interface, and the primosome helicase is ready to begin a new unwinding-rotation-hydrolysis cycle.
Figure 18
Figure 18. Free Energy Surface (FES) depictions of DNA ‘breathing’ fluctuations and the equilibria between ‘open’ and ‘closed’ states
(a) A labeled base site (shown in red) in duplex DNA experiences distortion of its local environment, which corresponds to an increase of the free energy. Nucleation of a locally disordered ‘bubble’ conformation can be described in terms of the intersection of two distinct free energy surfaces. (b) At temperatures below the melting transition, the ordered B-form conformation is favored, while disordered conformations become progressively more stable as the temperature is raised.
Figure 19
Figure 19. Schematic representation for the melting curve of long heterogeneous duplex DNA, as monitored by circular dichroism. The cartoons show the initial formation of open AT-rich ‘bubbles’ as the temperature approaches Tm
Figure 20
Figure 20. FES diagrams for DNA ‘breathing’ and DNA-ligand (DNA-protein) complex formation
(a) Ligand association can be described as a process facilitated by a local conformational fluctuation experienced by a labeled base site (shown in red). A thermally activated ‘open conformation’ can form a portion of the transition state connecting the stable duplex state and the DNA-ligand complex. (b) A conformational transition from B-form to a disordered state at a local site close to a ss-dsDNA fork junction can be a bridge to the formation of a DNA-protein complex. The presence of the bound protein can stabilize or ‘trap’ the disordered state, as indicated by the locations of the minima of the corresponding FESs. (c) As the labeled site is varied across the boundary separating the duplex from the single-stranded region, the relative stabilities of the native B-form conformation and the disordered ‘open’ conformation interchange, similar to the melting phase-boundary behavior depicted in Fig. 18c.
Figure 21
Figure 21. Electronic coupling within base analogue dimer probes
(a) 2-aminopurine (2-AP) is a fluorescent analogue of adenine. The electronic transition dipole moments of the 2-AP base residues (shown as blue double-headed arrows) in the dinucleotide can couple producing the shared exciton levels shown in panel (b). The inset in panel (b) shows as an example the configuration of a ‘side-by-side’ dipole configuration with twist angle θ12 and base separation R12. Such ‘base-stacked’ configurations lead to blue-shifted absorbance and quenched fluorescence peaks. From ref. .
Figure 22
Figure 22. The principles of two-dimensional fluorescence spectroscopy (2DFS) measurements on fluorescent dinucleotide base analogues
(a) A pulse sequence used to determine the conformation of an exciton-coupled molecular dimer in a 2DFS experiment. The experiment detects fluorescence from electronic populations excited by the four-pulse sequence. (b) An experimental 2D fluorescence spectrum (both real and imaginary parts) is shown, which was obtained from a 5-μM solution of 2-AP dinucleotide in aqueous buffer. The 2D spectra exhibit diagonal peaks and off-diagonal cross-peaks that indicate the exciton-split states of the dimer. (c) Analysis of the 2DFS data revealed that the 2-AP dinucleotide is fully stacked in solution. Figure adapted from ref. .
Figure 23
Figure 23. Molecular and instrumental setups for monitoring simultaneous smFRET and smFLD signals
(a) The T4 gp41 helicase binds to the d(T)29 loading sequence on the lagging strand of a model DNA replication fork construct. An assembled (gp41)6·gp61·DNA primosome complex can unwind the duplex region of the DNA in the presence of GTP. The strands within the dsDNA region are internally labeled with the FRET donor-acceptor iCy3 and iCy5 chromophores, respectively. (b) TIRF excitation scheme and detection method. The polarization of the excitation beam is modulated at 1 MHz. The p-polarization component points in the direction of the y-axis, and the s-polarization component is contained within the x-z plane. (c) Orthogonally polarized directions used to measure the FLD signal, from the perspective of the incident beam. Figure adapted from .
Figure 24
Figure 24. Free energy landscapes that describe the weak and strong binding of the T4-coded helicase complexes to the replication fork junction
Hexameric gp41 (blue ovals), are bound together by inter-subunit NTP ligands (not shown), and binds weakly to the ss-ds junction of a replication fork, favoring disassociation from the DNA. Introduction of gp61 primase, in a 6:1 gp41 to gp61 subunit ratio, causes the T4 primosome helicase to bind strongly to a replication fork. A hypothetical free energy landscape describing the sugar-phosphate backbone fluctuations near the fork junction is shown representing each of the three conformational states: unbound DNA fork substrate (red), weakly bound DNA·(gp41)6 helicase complex (blue), and strongly-bound DNA·(gp41)6·gp61 primosome complex.
Figure 25
Figure 25. Dynamics of breathing fluctuations at the replication fork in the absence and presence of helicase
(a) Histograms of relaxation times (τc) obtained from the analysis of smFRET / smFLD trajectories for DNA fork constructs, which were labeled with iCy3 / iCy5 placed deep in a duplex region (blue) or at the replication fork junction (red), in the absence of DNA unwinding proteins. (b) A comparison is shown for a fork labeled construct in the absence (red) and the presence (blue) of 300 nM gp41 and 6 μM GTPγS. (c) A comparison is shown of histograms of the relative magnitudes 〈S2〉 − 〈S2 of the fluctuating smFLDr signal for duplex labeled DNA (left panel), fork labeled DNA (middle), and fork labeled DNA + (gp41 ∙ GTPγS)6 (right). Histograms of the relaxation times were characterized using the Gamma distribution function, with skewedness and width parameters α (dimensionless) and β (in units of ms), respectively. Figure adapted from .

References

    1. Watson JD, Crick FH. Nature. 1953;171:737–738. - PubMed
    1. Bessman MJ, Lehman IR, Simms ES, Kornberg A. J Biol Chem. 1958;233:171–177. - PubMed
    1. Lehman IR, Bessman MJ, Simms ES, Kornberg A. J Biol Chem. 1958;233:163–170. - PubMed
    1. Benson EE, Linderstrom-Lang K. Biochimica et biophysica acta. 1959;32:579–581. - PubMed
    1. Linderstrom-Lang K. Biochimica et biophysica acta. 1955;18:308. - PubMed

Publication types