Inhibition of NADPH Oxidase Mediates Protective Effect of Cardiotonic Pills against Rat Heart Ischemia/Reperfusion Injury
- PMID: 23840265
- PMCID: PMC3690747
- DOI: 10.1155/2013/728020
Inhibition of NADPH Oxidase Mediates Protective Effect of Cardiotonic Pills against Rat Heart Ischemia/Reperfusion Injury
Abstract
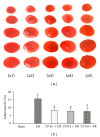
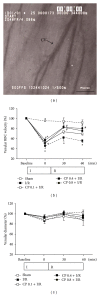
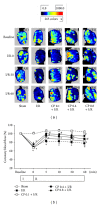
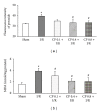
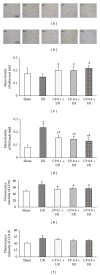
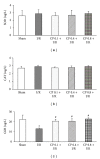
Cardiotonic pill (CP) is a compound Chinese medicine currently used in China for treatment of ischemic angina pectoris. Our previous results indicated that a single dosing of CP pretreatment at 0.8 g/kg attenuates ischemia/reperfusion- (I/R-) induced myocardial injury and cardiac microcirculatory disturbance. The present study aimed to investigate the effect of CP at low dosage in a multiple dosing manner and to uncover the mechanism of antioxidative activity of CP. Male Sprague-Dawley rats were subjected to left anterior descending artery occlusion for 30 min followed by 60 min reperfusion. CP was administrated daily by gavage for six days at 0.1, 0.4, and 0.8 g/kg/day before I/R. Results showed that multiple dosing of CP at three doses significantly reduced I/R-induced myocardial injury, microcirculatory disturbance, and oxidative stress. CP dramatically inhibited I/R-induced nicotinamide adenosine dinucleotide phosphate (NADPH) oxidase subunit gp91(phox) expression and p67(phox) and p47(phox) translocation from cytosol to cell membrane. Translocation of cytosolic subunits to membrane is required for the activation of NADPH oxidase. These data suggested that multiple dosing of CP at doses ranging from 0.1 to 0.8 g/kg/day reduced I/R-induced rat myocardial injury and microcirculatory disturbance, which was mediated by inhibition of NADPH oxidase activation.
Figures




Similar articles
-
Cardiotonic pills, a compound Chinese medicine, protects ischemia-reperfusion-induced microcirculatory disturbance and myocardial damage in rats.Am J Physiol Heart Circ Physiol. 2010 Apr;298(4):H1166-76. doi: 10.1152/ajpheart.01186.2009. Epub 2010 Jan 29. Am J Physiol Heart Circ Physiol. 2010. PMID: 20118406
-
Role of NADPH oxidase in total salvianolic acid injection attenuating ischemia-reperfusion impaired cerebral microcirculation and neurons: implication of AMPK/Akt/PKC.Microcirculation. 2014 Oct;21(7):615-27. doi: 10.1111/micc.12140. Microcirculation. 2014. PMID: 24702968
-
The interaction between oxidative stress and mast cell activation plays a role in acute lung injuries induced by intestinal ischemia-reperfusion.J Surg Res. 2014 Apr;187(2):542-52. doi: 10.1016/j.jss.2013.10.033. Epub 2013 Oct 21. J Surg Res. 2014. PMID: 24275574
-
Sevoflurane ameliorates intestinal ischemia-reperfusion-induced lung injury by inhibiting the synergistic action between mast cell activation and oxidative stress.Mol Med Rep. 2015 Jul;12(1):1082-90. doi: 10.3892/mmr.2015.3527. Epub 2015 Mar 23. Mol Med Rep. 2015. PMID: 25815524 Free PMC article.
-
[Molecular aspects of chronic granulomatous disease. "the NADPH oxidase complex"].Bull Acad Natl Med. 2007 Feb;191(2):377-90; discussion 390-2. Bull Acad Natl Med. 2007. PMID: 17969555 Review. French.
Cited by
-
Role of Oxidative Stress in Reperfusion following Myocardial Ischemia and Its Treatments.Oxid Med Cell Longev. 2021 May 18;2021:6614009. doi: 10.1155/2021/6614009. eCollection 2021. Oxid Med Cell Longev. 2021. PMID: 34055195 Free PMC article. Review.
-
Compound danshen dripping pills modulate the perturbed energy metabolism in a rat model of acute myocardial ischemia.Sci Rep. 2016 Dec 1;6:37919. doi: 10.1038/srep37919. Sci Rep. 2016. PMID: 27905409 Free PMC article.
-
The Role of Traditional Chinese Medicine in the Regulation of Oxidative Stress in Treating Coronary Heart Disease.Oxid Med Cell Longev. 2019 Feb 24;2019:3231424. doi: 10.1155/2019/3231424. eCollection 2019. Oxid Med Cell Longev. 2019. PMID: 30918578 Free PMC article. Review.
-
A Comparative Study on the Neuroprotective Effect of Geopung-Chunghyuldan on In Vitro Oxygen-Glucose Deprivation and In Vivo Permanent Middle Cerebral Artery Occlusion Models.Pharmaceuticals (Basel). 2023 Apr 15;16(4):596. doi: 10.3390/ph16040596. Pharmaceuticals (Basel). 2023. PMID: 37111353 Free PMC article.
-
Shared Inflammatory Pathology of Stroke and COVID-19.Int J Mol Sci. 2022 May 5;23(9):5150. doi: 10.3390/ijms23095150. Int J Mol Sci. 2022. PMID: 35563537 Free PMC article. Review.
References
-
- American Heart Association. Learn and Live. Know the Facts, Get the Stats. Dallas, Tex, USA: American Heart Association; 2006.
-
- Powers SK, Murlasits Z, Wu M, Kavazis AN. Ischemia-reperfusion-induced cardiac injury: a brief review. Medicine and Science in Sports and Exercise. 2007;39(9):1529–1536. - PubMed
-
- Ambrosio G, Becker LC, Hutchins GM, Weisman HF, Weisfeldt ML. Reduction in experimental infarct size by recombinant human superoxide dismutase: insights into the pathophysiology of reperfusion injury. Circulation. 1986;74(6):1424–1433. - PubMed
-
- Hamilton KL. Antioxidants and cardioprotection. Medicine and Science in Sports and Exercise. 2007;39(9):1544–1553. - PubMed
-
- Pagliaro P, Moro F, Tullio F, Perrelli M, Penna C. Cardioprotective pathways during reperfusion: focus on redox signaling and other modalities of cell signaling. Antioxidants and Redox Signaling. 2011;14(5):833–850. - PubMed
LinkOut - more resources
Full Text Sources
Other Literature Sources
Miscellaneous

