

Coregulation of Terpenoid Pathway Genes and Prediction of Isoprene Production in Bacillus subtilis Using Transcriptomics
- PMID: 23840410
- PMCID: PMC3686787
- DOI: 10.1371/journal.pone.0066104
Coregulation of Terpenoid Pathway Genes and Prediction of Isoprene Production in Bacillus subtilis Using Transcriptomics
Abstract
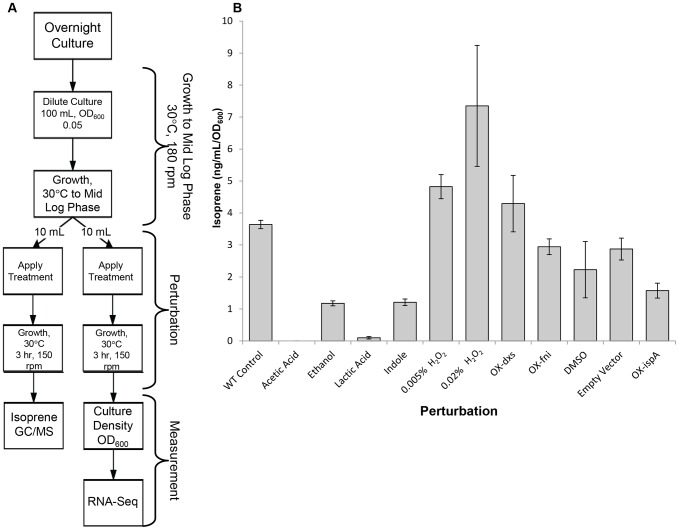
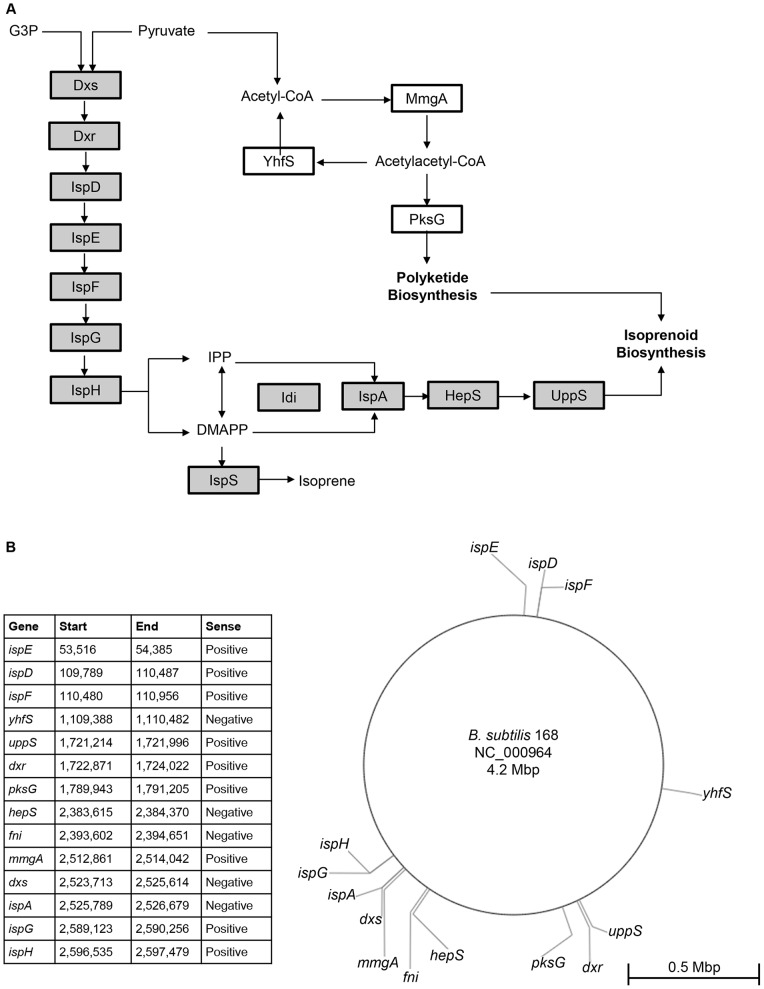
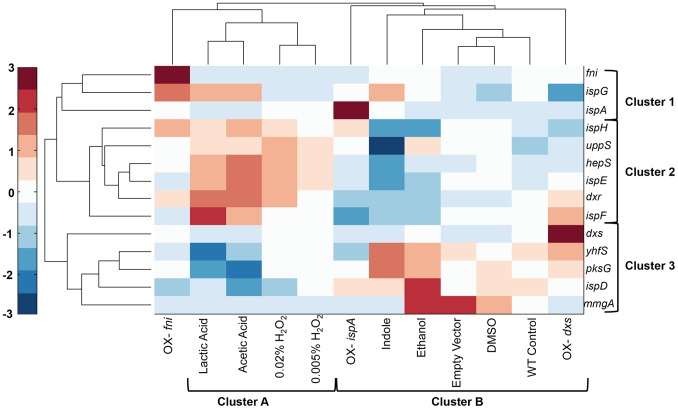
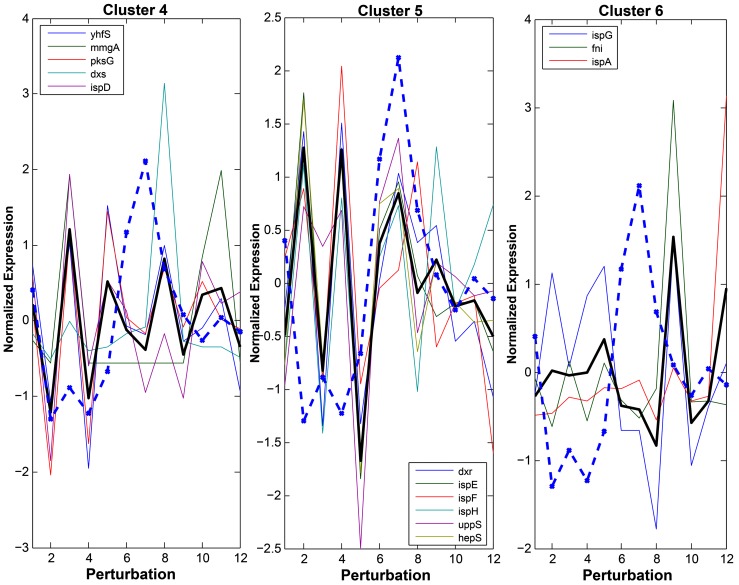
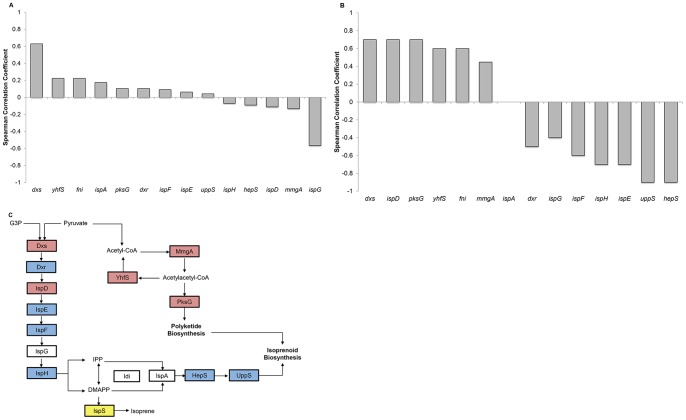
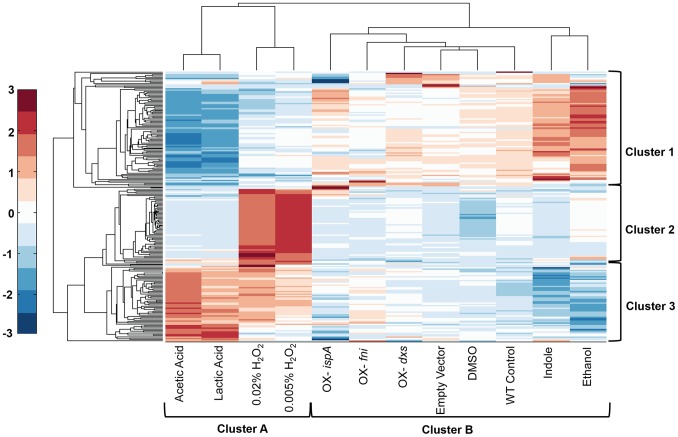
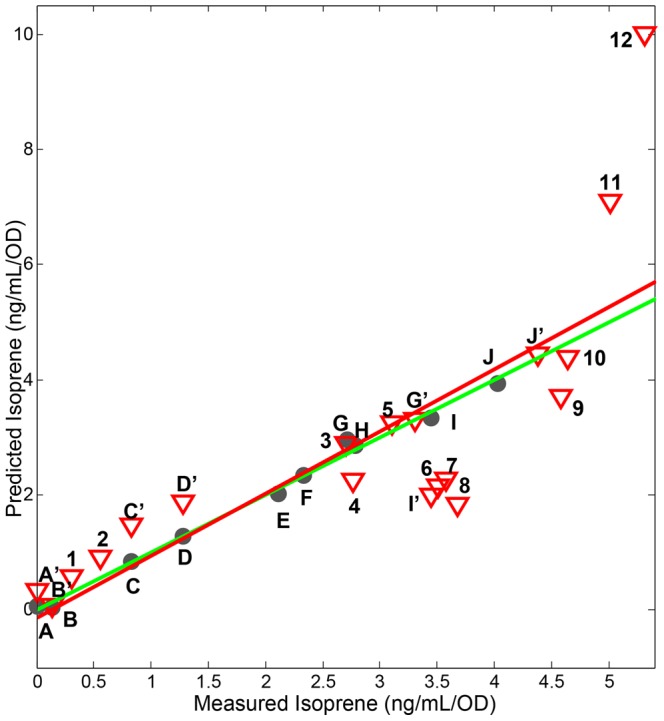
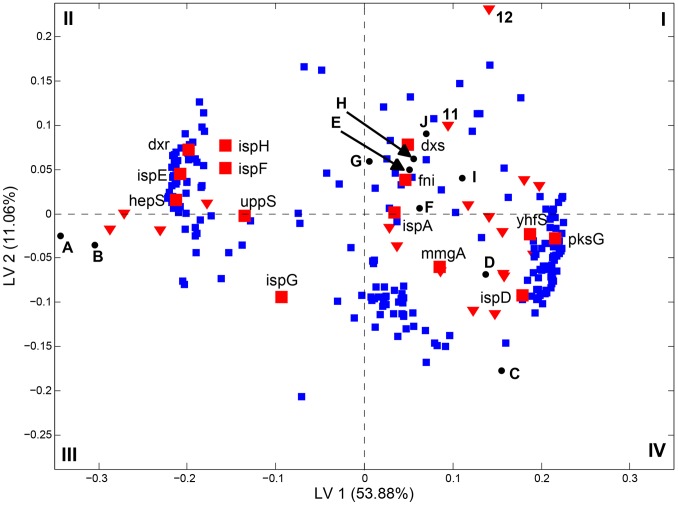
The isoprenoid pathway converts pyruvate to isoprene and related isoprenoid compounds in plants and some bacteria. Currently, this pathway is of great interest because of the critical role that isoprenoids play in basic cellular processes, as well as the industrial value of metabolites such as isoprene. Although the regulation of several pathway genes has been described, there is a paucity of information regarding system level regulation and control of the pathway. To address these limitations, we examined Bacillus subtilis grown under multiple conditions and determined the relationship between altered isoprene production and gene expression patterns. We found that with respect to the amount of isoprene produced, terpenoid genes fall into two distinct subsets with opposing correlations. The group whose expression levels positively correlated with isoprene production included dxs, which is responsible for the commitment step in the pathway, ispD, and two genes that participate in the mevalonate pathway, yhfS and pksG. The subset of terpenoid genes that inversely correlated with isoprene production included ispH, ispF, hepS, uppS, ispE, and dxr. A genome-wide partial least squares regression model was created to identify other genes or pathways that contribute to isoprene production. These analyses showed that a subset of 213 regulated genes was sufficient to create a predictive model of isoprene production under different conditions and showed correlations at the transcriptional level. We conclude that gene expression levels alone are sufficiently informative about the metabolic state of a cell that produces increased isoprene and can be used to build a model that accurately predicts production of this secondary metabolite across many simulated environmental conditions.
Conflict of interest statement
Figures
Similar articles
-
Positioning Bacillus subtilis as terpenoid cell factory.J Appl Microbiol. 2021 Jun;130(6):1839-1856. doi: 10.1111/jam.14904. Epub 2020 Nov 20. J Appl Microbiol. 2021. PMID: 33098223 Free PMC article. Review.
-
Identification of isopentenol biosynthetic genes from Bacillus subtilis by a screening method based on isoprenoid precursor toxicity.Appl Environ Microbiol. 2007 Oct;73(19):6277-83. doi: 10.1128/AEM.00861-07. Epub 2007 Aug 10. Appl Environ Microbiol. 2007. PMID: 17693564 Free PMC article.
-
Synthesis of Heterologous Mevalonic Acid Pathway Enzymes in Clostridium ljungdahlii for the Conversion of Fructose and of Syngas to Mevalonate and Isoprene.Appl Environ Microbiol. 2017 Dec 15;84(1):e01723-17. doi: 10.1128/AEM.01723-17. Print 2018 Jan 1. Appl Environ Microbiol. 2017. PMID: 29054870 Free PMC article.
-
Enhancing isoprene production by genetic modification of the 1-deoxy-d-xylulose-5-phosphate pathway in Bacillus subtilis.Appl Environ Microbiol. 2011 Apr;77(7):2399-405. doi: 10.1128/AEM.02341-10. Epub 2011 Feb 4. Appl Environ Microbiol. 2011. PMID: 21296950 Free PMC article.
-
Biotechnological potential for degradation of isoprene: a review.Crit Rev Biotechnol. 2018 Jun;38(4):587-599. doi: 10.1080/07388551.2017.1379467. Epub 2017 Dec 12. Crit Rev Biotechnol. 2018. PMID: 29233013 Review.
Cited by
-
Excavating the functionally crucial active-site residues of the DXS protein of Bacillus subtilis by exploring its closest homologues.J Genet Eng Biotechnol. 2020 Nov 26;18(1):76. doi: 10.1186/s43141-020-00087-x. J Genet Eng Biotechnol. 2020. PMID: 33242110 Free PMC article.
-
Antibacterial activity in secondary metabolite extracts of heterotrophic bacteria against Vibrio alginolyticus, Aeromonas hydrophila, and Pseudomonas aeruginosa.F1000Res. 2020 Dec 21;9:1491. doi: 10.12688/f1000research.26215.1. eCollection 2020. F1000Res. 2020. PMID: 33537126 Free PMC article.
-
A Programmable CRISPR/Cas9 Toolkit Improves Lycopene Production in Bacillus subtilis.Appl Environ Microbiol. 2023 Jun 28;89(6):e0023023. doi: 10.1128/aem.00230-23. Epub 2023 Jun 5. Appl Environ Microbiol. 2023. PMID: 37272803 Free PMC article.
-
Positioning Bacillus subtilis as terpenoid cell factory.J Appl Microbiol. 2021 Jun;130(6):1839-1856. doi: 10.1111/jam.14904. Epub 2020 Nov 20. J Appl Microbiol. 2021. PMID: 33098223 Free PMC article. Review.
-
Bacterial terpenome.Nat Prod Rep. 2021 May 26;38(5):905-980. doi: 10.1039/d0np00066c. Nat Prod Rep. 2021. PMID: 33169126 Free PMC article. Review.
References
-
- Gershenzon J, Dudareva N (2007) The function of terpene natural products in the natural world. Nat Chem Biol 3: 408–414. - PubMed
-
- Connolly JD (1991) Dictionary of terpenoids. In: Hall/CRC C, editor. Dictionary of terpenoids. 2156.
Publication types
MeSH terms
Substances
LinkOut - more resources
Full Text Sources
Other Literature Sources
Molecular Biology Databases
