. 2013 Jun 19;8(6):e66313.
doi: 10.1371/journal.pone.0066313. Print 2013.

Flavor-Enhanced Modulation of Cerebral Blood Flow during Gum Chewing

Affiliations

Flavor-Enhanced Modulation of Cerebral Blood Flow during Gum Chewing

Yoko Hasegawa et al. PLoS One. .

Abstract

Background: Flavor perception, the integration of taste and odor, is a critical factor in eating behavior. It remains unclear how such sensory signals influence the human brain systems that execute the eating behavior.

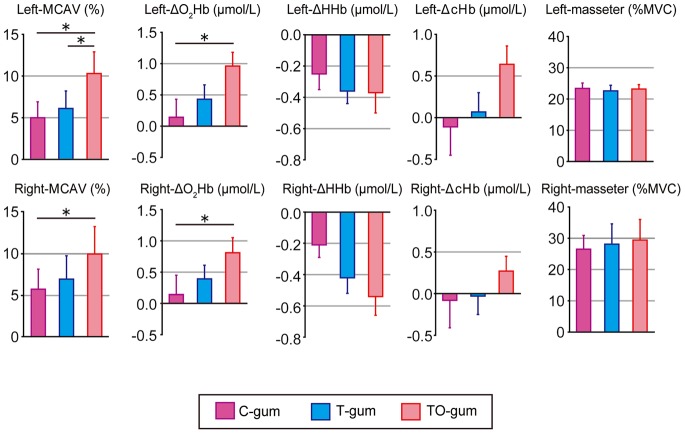
Methods: WE TESTED CEREBRAL BLOOD FLOW (CBF) IN THE FRONTAL LOBES BILATERALLY WHILE SUBJECTS CHEWED THREE TYPES OF GUM WITH DIFFERENT COMBINATIONS OF TASTE AND ODOR: no taste/no odor gum (C-gum), sweet taste/no odor gum (T-gum), and sweet taste/lemon odor gum (TO-gum). Simultaneous recordings of transcranial Doppler ultrasound (TCD) and near infrared spectrometer (NIRS) were used to measure CBF during gum chewing in 25 healthy volunteers. Bilateral masseter muscle activity was also monitored.

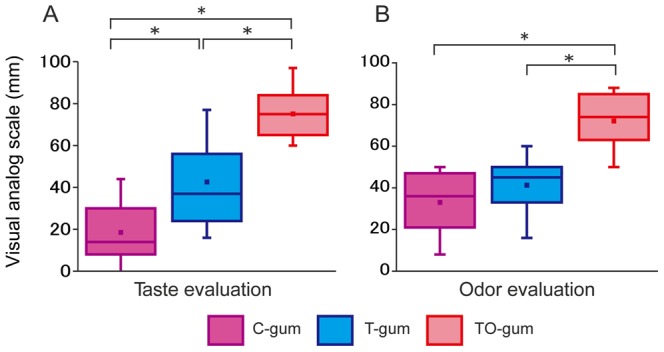
Results: We found that subjects could discriminate the type of gum without prior information. Subjects rated the TO-gum as the most flavorful gum and the C-gum as the least flavorful. Analysis of masseter muscle activity indicated that masticatory motor output during gum chewing was not affected by taste and odor. The TCD/NIRS measurements revealed significantly higher hemodynamic signals when subjects chewed the TO-gum compared to when they chewed the C-gum and T-gum.

Conclusions: These data suggest that taste and odor can influence brain activation during chewing in sensory, cognitive, and motivational processes rather than in motor control.


Conflict of interest statement

Competing Interests: The authors have declared that no competing interests exist.

Figures

Figure 1
Figure 1. Summaries of Visual Analog Scales (VAS) of taste (A) and odor (B) of tested gums (N = 25).
Each scale ranged from 0 (worst) to 100 (best). The boxes are constructed with the top line bounding the first-quartile and the bottom line bounding the third quartile. The horizontal line and the dot in the box indicate the median and mean values, respectively. The short horizontal lines show the largest and smallest values. **P<0.01, ***P<0.001. C-gum (purple): the gum with no taste and no odor (control), T-gum (blue): the gum with the sweet taste only, and TO-gum (red): the gum with sweet taste and lemon odor.
Figure 2
Figure 2. The cerebral hemodynamic changes, associated with TO-gum chewing, simultaneously measured by Transcranial Doppler Ultrasound (TCD) (A) and near infrared spectroscopy (NIRS) (B).
Both hemodynamic signals were measured from the left hemisphere. In (A), middle cerebral artery blood flow velocity (MCAV) is shown. In (B), oxygenated hemoglobin (ΔO2Hb) is represented by a red line, deoxygenated hemoglobin (ΔHHb) by a yellow line, and total hemoglobin (ΔcHb) by a green line.
Figure 3
Figure 3. Temporal profiles of averaged (N = 25) hemodynamic changes in the left and right hemispheres measured by TCD (A) and NIRS (B–D) during chewing of three different gums.
In (A), the data obtained during putting the TO-gum on the tongue are also superimposed as gray lines. In the NIRS signals (B–D), ΔO2Hb is shown in (B), ΔHHb in (C), and ΔcHb in (D). Data are represented as mean ± SEM every 1 min. A bold bar in each panel indicates the duration of the gum-chewing test. Statistical comparisons were performed between the control value (i.e., before chewing) and the value measured at each time point. Significant differences are represented by individual symbols: *, control vs. TO-gum; , control vs. T-gum; $, control vs. C-gum. Statistically significant levels were set at P = 0.005 ( = 0.05/10) by one-way ANOVA and Bonferroni's correction for multiple comparisons.
Figure 4
Figure 4. Summaries of hemodynamic changes in the left (top panels) and right (bottom panels) cerebral hemispheres and masseter EMG activity associated with chewing of three different types of gum.
In the hemodynamic changes, MCAV, ΔO2Hb, ΔHHb, and ΔcHb are arranged from the left to the right. Individual data (mean ± SEM) are represented as change rates of the responses between gum-chewing tests (5 min) and before the test. Statistical comparisons were performed among the three gums. *P<0.05, **P<0.01.

References

    1. Buck L, Axel R (1991) A novel multigene family may encode odorant receptors: a molecular basis for odor recognition. Cell 65: 175–187. - PubMed
    1. Shepherd GM (2006) Smell images and the flavour system in the human brain. Nature 444: 316–321. - PubMed
    1. Cruz A, Green BG (2000) Thermal stimulation of taste. Nature 403: 889–892. - PubMed
    1. Kringelbach ML, O'Doherty J, Rolls ET, Andrews C (2003) Activation of the human orbitofrontal cortex to a liquid food stimulus is correlated with its subjective pleasantness. Cereb Cortex 13: 1064–1071. - PubMed
    1. Yamamoto T (2006) Neural substrates for the processing of cognitive and affective aspects of taste in the brain. Arch Histol Cytol 69: 243–255. - PubMed

Publication types