. 2013 Jun 19;8(6):e66437.
doi: 10.1371/journal.pone.0066437. Print 2013.

Monitoring Seasonal Changes in Winery-Resident Microbiota

Affiliations

Monitoring Seasonal Changes in Winery-Resident Microbiota

Nicholas A Bokulich et al. PLoS One. .

Abstract

During the transformation of grapes to wine, wine fermentations are exposed to a large area of specialized equipment surfaces within wineries, which may serve as important reservoirs for two-way transfer of microbes between fermentations. However, the role of winery environments in shaping the microbiota of wine fermentations and vectoring wine spoilage organisms is poorly understood at the systems level. Microbial communities inhabiting all major equipment and surfaces in a pilot-scale winery were surveyed over the course of a single harvest to track the appearance of equipment microbiota before, during, and after grape harvest. Results demonstrate that under normal cleaning conditions winery surfaces harbor seasonally fluctuating populations of bacteria and fungi. Surface microbial communities were dependent on the production context at each site, shaped by technological practices, processing stage, and season. During harvest, grape- and fermentation-associated organisms populated most winery surfaces, acting as potential reservoirs for microbial transfer between fermentations. These surfaces harbored large populations of Saccharomyces cerevisiae and other yeasts prior to harvest, potentially serving as an important vector of these yeasts in wine fermentations. However, the majority of the surface communities before and after harvest comprised organisms with no known link to wine fermentations and a near-absence of spoilage-related organisms, suggesting that winery surfaces do not overtly vector wine spoilage microbes under normal operating conditions.


Conflict of interest statement

Competing Interests: NAB, PMR, and DAM own shares in MicroTrek, a service company providing microbiota monitoring for the food and beverage industry. NAB did receive financial support from a commercial source, Dannon Company, Inc., in the form of a competitive graduate student fellowship. This does not alter the authors' adherence to all the PLOS ONE policies on sharing data.

Figures

Figure 1
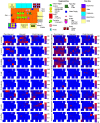
Figure 1. Spatial distribution heatmaps of yeasts and bacteria in winery environment across harvest.
Plots indicate relative abundance of yeast (left) and bacterial taxa (right) detected by short-amplicon HTS reads across winery surfaces at different stages relative to harvest. Scales on right represent relative abundance scale (maximum 1.0) for each row of plots.
Figure 2
Figure 2. Seasonal flux in species diversity observed across winery surfaces.s
(A) Absolute abundance of fungi (top, as cells/cm2) and bacteria (bottom, as 16S rRNA gene copies/cm2) detected on select surfaces by QPCR at different stages relative to harvest. Bar plots to right indicate mean (±SD) abundance of all grape elevator (ELEV), crusher (CRUSH), press, and fermentor (FERM) communities before (red), during (blue), and after harvest (orange). *P<0.05, two-sample T-tests. (B) Bacterial phylogenetic diversity (PD), a measurement of net branch-length distance on a single phylogenetic tree that is covered in each sample (left) and bacterial Shannon entropy (right) average (±SD) alpha-diversity scores for grape crush-related equipment (top, N = 42) and floor samples (bottom, N = 90). Two-sample T-test P scores shown for significantly differing categories. (C) Average relative abundance (maximum 1.0) ±SD of select bacterial genera associated with fermentation vessel samples at peak harvest. One-way ANOVA P values (with Bonferroni error correction) shown for significance between each category. P, pre-harvest (N = 14); H, harvest (N = 14); A, post-harvest (N = 14). (D) Jackknifed beta-diversity PCoA plots for crush equipment (left), fermentation vessels (center), and floor surface samples (right) categorized by sampling date. Value in lower-right corner indicates permutational MANOVA P-value between categories, sample size (N) in upper-right corner. UUF, unweighted UniFrac distance; WUF, abundance-weighted UniFrac distance.
Figure 3
Figure 3. Winery surface species diversity illustrates functional niche selection.
(A) Jackknifed beta-diversity PCoA plots for pre-harvest (top), peak harvest (center), and post-harvest (bottom) samples categorized by surface type. Values in lower-right corners indicate permutational MANOVA P-values between categories, sample size (N) in upper-right corners. WUF, abundance-weighted UniFrac distance. Relative taxonomic distribution of (B) order-level bacterial community abundance and (C) family-level fungal community abundance of all surface type categories. Each column represents average abundance of microbial taxa detected in all samples from each category for all three timepoints.
Figure 4
Figure 4. Significant between-category differences in abundance of fermentation-related taxa reflects niche selection within winery surface types.
Each column represents average relative abundance (maximum 1.0) ± SD of select microbial taxa detected in all samples from each category for all three timepoints. One-way ANOVA P values (with Bonferroni error correction) shown for significance between each category. PFDR = false discovery rate-corrected P value; Ferm, fermentor sample mean. Only one sample was collected for CO2 tube category and thus not included in statistical calculations.
Figure 5
Figure 5. Barrel surfaces comprise unique microbial communities.
(A) Average relative abundance (maximum 1.0) ± SD of Shewanella (left) and Pseudomonas (right) detected in all samples from each category for all three timepoints. One-way ANOVA P values (with Bonferroni error correction) shown for significance between each category. (B) Average relative abundance (±SD) of fungal species exhibiting significant differences between exterior (dark grey, N = 5) and interior (light grey, N = 3) barrel surfaces prior to harvest. *P<0.05, two-sample T-test.

Similar articles

Cited by

References

    1. Bokulich NA, Mills DA (2012) Next-generation approaches to the microbial ecology of food fermentations. BMB reports 45: 377–389. - PubMed
    1. Peynaud E, Domercq S (1959) A review of microbiological problems in wine-making in France. Am J Enol Vitic 10: 69–77.
    1. Ocon E, Gutierrez AR, Garijo P, Lopez R, Santamaria P (2010) Presence of non-Saccharomyces yeasts in cellar equipment and grape juice during harvest time. Food Microbiol 27: 1023–1027. - PubMed
    1. Bokulich NA, Bamforth CW, Mills DA (2012) Brewhouse-resident microbiota are responsible for multi-stage fermentation of American coolship ale. PLoS ONE 7: e35507. - PMC - PubMed
    1. Dolci P, Barmaz A, Zenato S, Pramotton R, Alessandria V, et al. (2009) Maturing dynamics of surface microflora in Fontina PDO cheese studied by culture-dependent and -independent methods. J Appl Microbiol 106: 278–287. - PubMed

Publication types