. 2013 Jun 19;8(6):e66992.
doi: 10.1371/journal.pone.0066992. Print 2013.

In-Situ Effects of Simulated Overfishing and Eutrophication on Benthic Coral Reef Algae Growth, Succession, and Composition in the Central Red Sea

Affiliations

In-Situ Effects of Simulated Overfishing and Eutrophication on Benthic Coral Reef Algae Growth, Succession, and Composition in the Central Red Sea

Christian Jessen et al. PLoS One. .

Abstract

Overfishing and land-derived eutrophication are major local threats to coral reefs and may affect benthic communities, moving them from coral dominated reefs to algal dominated ones. The Central Red Sea is a highly under-investigated area, where healthy coral reefs are contending against intense coastal development. This in-situ study investigated both the independent and combined effects of manipulated inorganic nutrient enrichment (simulation of eutrophication) and herbivore exclosure (simulation of overfishing) on benthic algae development. Light-exposed and shaded terracotta tiles were positioned at an offshore patch reef close to Thuwal, Saudi Arabia and sampled over a period of 4 months. Findings revealed that nutrient enrichment alone affected neither algal dry mass nor algae-derived C or N production. In contrast, herbivore exclusion significantly increased algal dry mass up to 300-fold, and in conjunction with nutrient enrichment, this total increased to 500-fold. Though the increase in dry mass led to a 7 and 8-fold increase in organic C and N content, respectively, the algal C/N ratio (18±1) was significantly lowered in the combined treatment relative to controls (26±2). Furthermore, exclusion of herbivores significantly increased the relative abundance of filamentous algae on the light-exposed tiles and reduced crustose coralline algae and non-coralline red crusts on the shaded tiles. The combination of the herbivore exclusion and nutrient enrichment treatments pronounced these effects. The results of our study suggest that herbivore reduction, particularly when coupled with nutrient enrichment, favors non-calcifying, filamentous algae growth with high biomass production, which thoroughly outcompetes the encrusting (calcifying) algae that dominates in undisturbed conditions. These results suggest that the healthy reefs of the Central Red Sea may experience rapid shifts in benthic community composition with ensuing effects for biogeochemical cycles if anthropogenic impacts, particularly overfishing, are not controlled.


Conflict of interest statement

Competing Interests: The authors have declared that no competing interests exist.

Figures

Figure 1
Figure 1. Inorganic nutrient (A) and Chlorophyll a (B) concentrations.
A: Inorganic nutrient concentrations (µmol L−1; means±SE) in the nutrient enrichment treatments (fertilizer & combined) and the non-enriched treatments (control & cage). Small letters (a for SRP; b for DIN) indicate statistical significant differences between enriched and non-enriched plots of p<0.05 (t-test). DIN: dissolved inorganic nitrogen; SRP: soluble reactive phosphate. B: Chlorophyll a concentrations (µg L−1, means±SE) from water samples taken directly above the tile setups at all 5 sampling times. P-values were calculated from 3-factorial ANOVA and originate from analysis across the whole study period (see Table 1 for full results). P-values were tagged as n.s. ( = not significant), when the model reduction step excluded the corresponding factor(s).
Figure 2
Figure 2. Concentrations of particulate and dissolved organic matter.
Particulate (mg cm−2, means±SE) and dissolved organic matter concentrations (µmol L−1, means±SE) in water samples taken directly above the installations A: particulate organic nitrogen (PON), B: particulate organic carbon (POC), C: dissolved organic nitrogen (DON), and D: dissolved organic carbon (DOC). Shown are data of all treatments for all 5 sampling times. P-values were calculated from 3-factorial ANOVA and originate from analysis across the whole study period (see Table 1 for full results). Abbreviations: C = Cage, F = Fertilizer, T = Time. Missing values of 1wk for PON and POC resulted from insufficient algal dry mass for analysis. Shown P-values originate from analysis across the whole study period. P-values were tagged as n.s. ( = not significant), when the model reduction step excluded the corresponding factor(s).
Figure 3
Figure 3. Development of algal dry mass (A), organic carbon (B), nitrogen content (C), and organic C/N ratio (D) on light-exposed tiles.
Shown are means±SE of all treatments in mg cm−2 over the 5 sampling points after 1, 2, 4, 8 and 16 wk(s). P-values were calculated from a 3-factorial ANOVA and originate from analysis across the whole study period (see Table 1 for full results). P-values were tagged as n.s. ( = not significant), when the model reduction step excluded the corresponding factor(s). Missing connections between data points are due to insufficient algal material for analysis. Abbreviations: C = Cage, F = Fertilizer, T = Time.
Figure 4
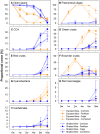
Figure 4. Percent cover of functional groups on light-exposed (orange) and shaded tiles (blue).
Shown is the proportional cover (means±SE) over the study period of 4 months of functional groups in the 4 treatments: control, fertilizer, cage, and combined. See Tables 3 and 4 for statistical results.
Figure 5
Figure 5. O2 consumption rates.
O2 consumption rates of A: light-exposed tiles and B: shaded tiles in µg cm−2 h−1 (means±SE). P-values are calculated from 3-factorial ANOVA and originate from analysis across the whole study period (see Table 5 for full test results). Significant p-values (p<0.05) are indicated by asterisks. Abbreviations: C = Cage, F = Fertilizer, T = Time.

References

    1. Burke LM, Reytar K, Spalding M, Perry A (2011) Reefs at Risk Revisited. Washington, DC: World Resources Institute.
    1. Selman M, Greenhalgh S, Diaz R, Sugg Z (2008) Eutrophication and hypoxia in coastal areas: a global assessment of the state of knowledge. World Resources Institute. Washington, DC.
    1. Wild C, Hoegh-Guldberg O, Naumann MS, Colombo-Pallotta MF, Ateweberhan M, et al. (2011) Climate change impedes scleractinian corals as primary reef ecosystem engineers. Mar Freshw Res 62: 205–215.
    1. Koop K, Booth D, Broadbent A, Brodie J, Bucher D, et al. (2001) ENCORE: the effect of nutrient enrichment on coral reefs. Synthesis of results and conclusions. Mar Pollut Bull 42: 91–120. - PubMed
    1. Fabricius KE, Cséke S, Humphrey C, De’ath G (2013) Does trophic status enhance or reduce the thermal tolerance of scleractinian corals? A review, experiment and conceptual framework. PLOS ONE 8: e54399. - PMC - PubMed

Publication types

LinkOut - more resources